In health care facilities, including ambulances, there are several sources of infectious agents including patients, staff, and the environment itself (including the air and on devices/instruments used) which can become contaminated.1-4 Healthcare personnel working in the ambulances may be at risk to blood-borne, airborne, droplet, and direct contact infections due to medical and health care practices administered to the patient (sometimes over a long period of time) in a closed air ventilation system and limited air space.5,6 These conditions may increase the risk of airborne and droplet infections, such as influenza, avian flu, severe acute respiratory syndrome (SARS), chickenpox, pulmonary tuberculosis, meningococcal meningitis, and Ebola.7-10 Personnel may be exposed to unrecognized or undiagnosed patients with these infections. A previous study showed that bus drivers in air conditioned buses were at risk to airborne and droplet infections due to the unhygienic condition of the air and poor ventilation.11,12 Patients with coughing, sneezing, or any other medical procedures that expel oral fluids into the air can generate aerosols in the ambulance air.13-15 Millions of tiny droplets of water and mucus are expelled at approximately 100 meters per second, larger droplets are deposited on surface environments, and smaller droplets dry rapidly to droplet nuclei of less than 5µm and contain virus particles or bacteria that can survive in the air and could be inhaled into the respiratory tract causing respiratory infections.15,16 Moreover, non-pathogenic microorganisms, especially airborne bacteria and fungi, may cause and trigger asthma or allergies among susceptible individuals and infections in persons with weak physical and immune conditions.17,18
In ambulance services, inadequate cleaning with disinfectants of medical instruments and the internal surfaces may increase the risk to healthcare personnel working in ambulances. Our study sought to assess the microbial air quality and levels of bacterial surface contamination on medical instruments and in the surrounding areas in selected ambulances during patient services of a provincial hospital network in north-eastern Thailand.
Methods
A cross-sectional study of 30 ambulance runs was conducted to assess microbial air quality (total bacterial and fungal counts) and bacterial surface contamination on medical instruments and surrounding areas during patient services of a provincial hospital network in north-eastern Thailand. The study was performed over a two-month period. Ethical approval was given by the ethical committee of Mahidol University, Faculty of Public Health (Reference No. MUPH 2009-184).
Air samples in the studied ambulances were collected for four minutes using the BioStage Impactor QuickTake 30 sample pump (SKC Inc, USA) with a fixed air flow rate of 28.3L/min. The air collection technique followed the active air sampling method.19 Duplicate air samples were collected upon starting ambulance runs (1–2 air collection points), and during patient services in ambulances (2–4 air collection points). Approximately, 30–40 minutes were taken in patient service in each ambulance run, and about eight minutes were taken for each point of air sample collection. Outdoor air samples used for comparison were collected before and after ambulance services. Total bacterial count was obtained in plate count agar (PCA), and total fungal count was cultivated in 4% sabouraud dextrose agar (SDA). The equipment and devices for air sample collection were non-critical.
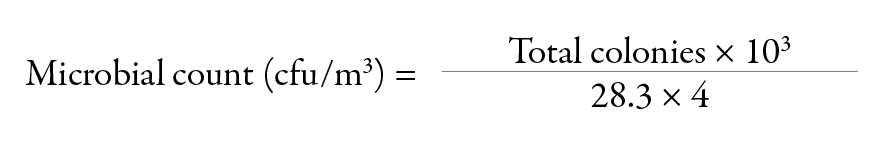
A total of 106 air samples (53 for bacterial counts and 53 for fungal counts) were collected at the start of ambulance runs and 212 air samples (106 for bacterial counts and 106 for fungal counts) collected during patient services in ambulances and were analyzed in this study. For outdoor air, 120 air samples (60 for bacterial counts and 60 for fungal counts) were included. Air samples for bacteria were incubated at 37°C for 48 hours and those for fungi were incubated at room temperature for five days with daily observation. After incubation, the bacterial and fungal colonies were counted and calculated to express as a colony forming unit/m3 (cfu/m3) using the following formula:
Therefore, in our study:
After counting the bacteria and fungi, the identification of colonies was performed according to their colony appearance, Gram’s stain, and microscopic morphology following Larone’s guide.20 Additionally, 226 surface swab samples were collected from medical instruments and allocated areas in studied ambulances before and after patient services to culture total bacteria using a sterile wet swab. Direct plating of surface swabs were cultivated using PCA and incubated at 37°C for 48 hours before counting.
The American Conference of Governmental Industrial Hygienist (ACGIH) committee suggested that the presence of bacterial or fungal counts exceeding 500cfu/m3 in an office workplace was an indication of poor ventilation or an unsanitary condition and needed remedial action.21 Our study followed the ACGIH recommended guideline for air quality interpretation. For medical instrument surfaces and allocated area surface swabs, a total bacterial count ≥5cfu/cm2 indicated high bacterial surface contamination.22,23
Data from the microbial air quality assessment and surface swab cultures were analyzed by descriptive statistics, including percentages, means, and standard deviations (SD). The comparison between microbial counts in air samples collected at starting ambulance runs and those collected during patient services was analyzed using t-test and proportional Z test. For bacterial surface contamination, the comparison between mean surface swab counts of before and after patient services was analyzed using paired t-test or Wilcoxon test. The correlation between bacterial and fungal counts in air samples and the bacterial surface contamination on medical instruments and allocated areas in studied ambulances was analyzed using Pearson’s correlation coefficient. The significance level was set at p<0.050.
Results
All study ambulances had a driver’s compartment and an aligned window with at least a 150 square inch opening for checking and communications. They had emergency medical sets, such as a cardiopulmonary resuscitation set, and various medical equipments and medication. Basic and advanced supplies, such as vascular access, ringer’s lactate or normal saline solution, antiseptic solution, intravenous catheters, needles and syringes, airway and ventilation equipment (e.g. laryngoscope handle, laryngoscope blades, endotracheal tube) were provided in all studied ambulances. Additionally, equipment for cardiac care (a portable, battery-operated monitor/defibrillator) and other advance equipment, such as a nubulizer, glucometer or blood glucose measuring device, pulse oximetry with pediatric and adult probes were available.
A total of 106 indoor air samples were collected at the start of ambulance runs, and 212 indoor air samples collected during patient services from the 30 ambulance runs enrolled in the study to investigate bacterial counts and fungal counts. It was found that the mean±SD of bacterial counts at starting ambulance runs was 318±485cfu/m3, and that of fungal counts was 522±581cfu/m3. During patient services the bacterial and fungal counts were 468±607cfu/m3 and 656±612cfu/m3, respectively. The mean bacterial and fungal counts during patient services in the studied ambulance runs were significantly higher than those of bacterial and fungal counts at the start of the runs, p=0.005 and p=0.030, respectively. The data are shown in Table 1.
Table 1: Distribution of microbial counts (cfu/m3) of air samples collected from 30 studied ambulance runs
(measurements were taken at the start of the run and during patient services).
|
Bacterial counts
Mean±SD |
23(76.6) |
2(6.7) |
5(16.7) |
19(63.3) |
4(13.4) |
7(23.3) |
4(13.3) |
4(13.3) |
|
318±485* |
468±607* |
537±577 |
518±589 |
|
16(53.3) |
4(13.4) |
10(33.3) |
11(36.6) |
5(16.7) |
14(46.7) |
10(33.3) |
12(40.0) |
* Statistically significant difference by t-test, p=0.005
** Statistically significant difference by t-test, p=0.030
Remarks: One to two air samples per ambulance run were collected at the start of runs, and three to four were collected during patient services. Two air samples per ambulance run were collected from outdoor air (one before the ambulance run and one after).
Table 2: Number and percentage of air samples of two levels of bacterial and fungal counts (≤500 and >500 cfu/m3) collected from the ambulances.
|
At start*n=53 |
44(83.4) |
9(17.0) |
33(62.3) |
20(37.7) |
|
During patient services n=106 |
78(73.6) |
28(26.4) |
52(49.1) |
54(50.9) |
*One to two air samples per ambulance run were collected at the start of runs and three to four air samples were collected during patient services** By proportional Z test
When the bacterial and fungal counts were described in detail and compared with the recommended ACGIH guidelines level, it was found that 17.0% of air samples collected at the start of ambulance runs (9/53 samples) and 26.4% of samples collected during patient services (28/106 samples) had bacterial counts more than the ACGIH recommended level (>500cfu/m3). This was also the case for fungal counts, with 37.7% of samples (20/53) collected at start of runs and 50.9% of samples (54/106) collected during services with fungal counts more than the recommended level [Table 2]. Both bacterial and fungal counts in air samples collected during patient services showed significantly higher percentages of high levels than those of air samples at the start of ambulance runs, p<0.010 [Table 2].
The bacterial and fungal colonies isolated from air samples in studied ambulances were preliminary identified. It was found that most isolated bacterial colonies (47.8–51.6%) were Staphylococcus spp., 35.2–37.8% were gram negative bacilli, and 13.2–14.4% were gram positive bacilli. The majority of isolated fungal colonies (55.6–58.7%) were Aspergillus spp., and 36.3–37.2% were Penicillium spp. The distribution of genus or groups of isolated bacteria and fungi from in-ambulance air was similar proportion with that from outdoor air [Table 3].
Table 3: Number and percentage of bacterial and fungal groups isolated from studied air samples in the ambulance and outdoor air samples.
|
Before ambulance runs |
|
Bacteria |
n=91 |
n=84 |
|
Staphylococcus spp. |
47(51.6)* |
40(47.6)* |
|
Gram negative bacilli |
32(35.2) |
29(34.5) |
|
Gram positive bacilli |
12(13.2) |
15 (17.9) |
|
Fungi |
n=124 |
n=98 |
|
Aspergillus spp. |
69(55.6) |
52(53.1) |
|
Penicillium spp. |
46(37.2) |
26(26.5) |
|
Fusarium spp. |
4(3.2) |
5(5.1) |
|
Septate hypha fungi |
2(1.6) |
13(13.3) |
|
Rizopus and Mucor |
3(2.4) |
2(2.0) |
|
During ambulance runs |
|
Bacteria |
n=90 |
n=84 |
|
Staphylococcus spp. |
43(47.8)* |
38(46.4)* |
|
Gram negative bacilli |
34(37.8) |
28(32.1) |
|
Gram positive bacilli |
13(14.4) |
18(19.7) |
|
Fungi |
n=121 |
n=98 |
|
Aspergillus spp. |
71(58.7) |
54(55.1) |
|
Penicillium spp. |
44(36.3) |
25(25.5) |
|
Fusarium spp. |
2(1.7) |
6(6.1) |
|
Septate hypha fungi |
1(0.8) |
10(10.2) |
*The majority (81–86%) were Staphylococcus aureus
A total of 452 surface swab samples before and after ambulance services (226 each) were collected from medical instrument surfaces and allocated areas in the studied ambulances. These included 44 samples each from stethoscopes and the adjustment knob of oxygen flows, 18 samples from long spinal boards, 60 samples each from stretcher mattresses, and air-flow adjustment fins. It was found that the mean±SD of overall bacterial surface counts before and after patient services were 0.8±0.7cfu/cm2 and 1.3±1.1cfu/cm2, respectively, p<0.001. However, no surface swab samples had bacterial counts more than the recommended count (≥5cfu/cm2) [Table 4].
Table 4: Mean and standard deviations (SD) of surface swab counts in studied ambulance before and after patient services.
|
Stethoscope |
44 |
0.8±0.9 |
44 |
1.7±1.7 |
0.002* |
|
Oxygen flow knob |
44 |
0.3±0.5 |
44 |
1.6±1.9 |
0.003* |
|
Long spinal boards |
18 |
0.3±0.4 |
18 |
1.0±1.4 |
0.063W |
|
Stretchers |
60 |
0.2±0.3 |
60 |
0.7±1.2 |
0.010* |
|
Air-flow fins |
60 |
0.6±0.7 |
60 |
1.6±1.6 |
<0.001* |
* Statistical significance by paired t-test at p=0.050
WNo statistical significance by Wilcoxon at p=0.050
Remark: No surface swab samples had bacterial counts more than the recommended count (≤5cfu/cm2).
The correlation between bacterial and fungal counts in air samples and the bacterial surface contamination on medical instruments and allocated areas in the ambulances was analyzed [Table 5]. It was found that bacterial and fungal counts in ambulance air revealed a significantly positive correlation with the bacterial surface contamination on medical instruments and allocated areas in ambulances (r=0.3, p<0.010 and r=0.2, p=0.020, respectively).
Table 5: The correlation between bacterial counts or fungal counts in air samples and the bacterial surface contamination on medical instruments and surrounding areas among studied ambulances.
|
Bacterial count |
r = 0.3, p <0.010* |
*statistically significant correlation at p=0.050
Discussion
An ambulance is a self-propelled vehicle specifically designed to transport critically sick or injured people to a medical facility. Ambulance personnel frequently have to take rapid action and provide medical care under life-or-death circumstances, and may be exposed to communicable diseases in the course of their duties.2,5 The risk towards these infections or diseases depends on a source of infectious agents, a susceptible host with a portal of entry receptive to the agent, and a mode of transmission.6,9 Contaminated environments, especially air and surface areas may be major sources of infectious agents.5,6,9
This short-term study of microbial counts in indoor air samples collected from 30 ambulance runs found that between 17.0% to 50.9% of air samples had a high level bacterial or fungal count indicating poor ventilation or unsanitary conditions.21 These high microbial counts in air samples occurred in some ambulance runs, which had more patient care activities. A previous study in dental clinics revealed that higher microbial counts were found during activities of works and after work.14 For surface swab samples, results revealed that bacterial counts on medical instruments and allocated areas in studied ambulances after patient services were significantly higher than those before patient services (p<0.050), with the exception of the long spinal board (p>0.050). A preliminary report demonstrated that several species of nosocomial pathogens were isolated in ambulances and formidable antibiotic resistance patterns.24 In addition, a study in German ambulances found methicillin resistant Staphylococcus aureus (MRSA) contamination in 18 sampling surfaces of 11 ambulances out of a total 150 studied ambulances.25
The United States Environmental Protection Agency (EPA) registered disinfectants or detergents/disinfectants that best met the overall needs of the healthcare facility for routine cleaning and disinfection should be selected. Routine surface cleaning is recommended to control the spread of pathogens in hospital environments, including ambulances. This was supported by Andersen et al,26 who found that moist and wet mopping is the most effective cleaning method to reducing bacteria on the floor. However, a preliminary investigation in Welsh emergency ambulances found that most sites within ambulances were contaminated with several species of bacteria before cleaning, and even after cleaning many sites were still contaminated.27
Although ambulance personnel regularly wore surgical masks to protect themselves from droplet infections, the evidence from a previous study in healthcare workers in a hospital who regularly wore surgical masks while taking care of patients showed high accumulation of bacteria and fungi on the inside and outside areas of the used surgical masks suggesting that they were unsuitable for preventing the infections.11,28 Additionally, several factors influenced the microbial load in indoor air, such as the number of patients, the air conditioning systems, and the ventilation. Some physical factors including heat, temperature, and humidity were also reported.12,29,30 Both personnel and patients are a potential source of microorganisms as they shed the microorganisms from the skin and the respiratory tract.17,31 Temperatures below 16°C and above 25°C caused a reduction in the concentration of airborne fungi. Furthermore, maintaining the relative humidity between 30–60% would help control mold and dust mites.29,32,33 Generally, most airborne bacteria and fungi do not affect healthy humans, but may affect human health including allergies and non-specific symptoms in susceptible persons, such as young children, the elderly, and immune-compromised individuals.17,18,34,35
Due to the high levels of microbial counts found in some ambulance runs, the air ventilation in ambulances should be improved. Previous studies demonstrated that the air-conditioned buses with open exhaust ventilation fans had significantly lower bacterial and fungal counts than those without open exhaust ventilation fans,12 and that the total number of microorganisms would be reduced after starting the air conditioning system for a few minutes.30 Additionally, an evaluation of ambulance decontamination using gaseous chlorine dioxide (ClO2) demonstrated that ClO2 gas could reduce a variety of bacteria in ambulances at least six-log.36
Most of isolated bacterial colonies from air samples (49.7%) were Staphyloccoccus spp., and most of the majority (81.6%) were Staphylococcus aureus. The most isolated fungal colonies (57.1%) were Aspergillus spp., and Penicillium spp. However, this bacterial air quality assessment and identification did not cover anaerobic and higher bacteria. According to European Commission Classification, most isolates from this study were considered potential candidates for causing sick building syndromes and associated with clinical manifestations of allergy, rhinitis, asthma, and conjunctivitis.32 A survey of airborne fungi in buildings and outdoor environments in the US (2002) found that Aspergillus spp. was the most common fungi,37 which was the same in our study. Moreover, our study found that bacterial and fungal counts in ambulance air had a significantly positive correlation with the bacterial surface contamination on medical instruments and allocated areas in ambulances. This evidence corresponded with the study of Nzeako et al,38 which demonstrated the correlation between sedimentation plate count and surface swab of fungi in hospital wards.38 In recent years, several studies on the application of ATP-activity for monitoring microbial loads in environmental samples (including surface and device swabs, aqueous humidifier samples, and ready-to-eat foods) were evaluated and was reported as a useful tool as it gave a good correlation with the
standard methods.39-41
The intervention program for reducing the microbial concentration in the air and on the surface areas in ambulances should emphasize the need for a ventilation improvement strategy, and improvement in the cleaning program of the ambulance environment, including medical instruments, seats, the floor, and air conditioning units. Additionally, the use of standard precautions, including hand hygiene and effective personal protective equipment (PPE) will prevent cross infection and save ambulance personnel’s lives.
Conclusion
This study revealed high microbial contamination (bacterial and fungal counts) in ambulance air during ambulance services and higher bacterial contamination on medical instrument surfaces and allocated areas after ambulance services compared to the start of ambulance runs. The predominant isolated bacteria and fungi in air samples were Staphylococcus spp. and Aspergillus spp., respectively. Additionally, bacterial and fungal counts in ambulance air showed a significantly positive correlation with the bacterial surface contamination on medical instruments and various areas tested in the studied ambulances. Future studies should be conducted to determine the optimal intervention to reduce the microbial contamination in ambulance air and surfaces.
Disclosure
The authors declared no conflicts of interest. Funding was received from the Thailand Research Fund and the Faculty of Public Health, Mahidol University (TRF-Window II Grant). A publication grant was awarded by the China Medical Board, Faculty of Public Health, Mahidol University.
Acknowledgements
The authors gratefully acknowledge the attentive support from the ambulances personnel who worked in emergency medical service in this province.
references
- Centers for Disease Control and Prevention (CDC). Severe acute respiratory syndrome–Singapore, 2003. MMWR Morb Mortal Wkly Rep 2003 May;52(18):405-411.
- Rischitelli G, Harris J, McCauley L, Gershon R, Guidotti T. The risk of acquiring hepatitis B or C among public safety workers: a systematic review. Am J Prev Med 2001 May;20(4):299-306.
- Luksamijarulkul P, Watagulsin P, Sujirarat D. Hepatitis B virus seroprevalence and risk assessment among personnel of a governmental hospital in Bangkok. Southeast Asian J Trop Med Public Health 2001 Sep;32(3):459-465.
- Luksamijarulkul P, Kiennukul N, Vatthanasomboon P. Laboratory facility design and microbial indoor air quality in selected hospital laboratories. Southeast Asian J Trop Med Public Health 2014 May;45(3):746-755.
- Luksamijarulkul P, Pipitsangjan S, Vatanasomboon P. Occupational risk towards blood-borne infections among ambulance personnel in a provincial hospital network in Thailand. Southeast Asian J Trop Med Public Health 2014 Jul;45(4):940-948.
- Speers D. Infectious diseases and the pre-hospital practitioner. J Emerg Prim Health Care 2003;1(1):1-9.
- Rueckmann E, Shah MN, Humiston SG. Influenza vaccination among emergency medical services and emergency department personnel. Prehosp Emerg Care 2009 Jan-Mar;13(1):1-5.
- Martin-Moreno JM, Llias G, Hernandez JM. Is respiratory protection appropriate in the Ebola response? The Lancet 2014 Sep; 384(9946):856.
- Mahomed O, Jinabhai CC, Taylor M, Yancey A. The preparedness of emergency medical services against occupationally acquired communicable diseases in the prehospital environment in South Africa. Emerg Med J 2007 Jul;24(7):497-500.
- Luksamijarulkul P, Supapvanit C, Loosereewanich P, Aiumlaor P. Risk assessment towards tuberculosis among hospital personnel: administrative control, risk exposure, use of protective barriers and microbial air quality. Southeast Asian J Trop Med Public Health 2004 Dec;35(4):1005-1011.
- Luksamijarulkul P, Sundhiyodhin V, Luksamijarulkul S, Kaewboonchoo O. Microbial air quality in mass transport buses and work-related illness among bus drivers of Bangkok Mass Transit Authority. J Med Assoc Thai 2004 Jun;87(6):697-703.
- Luksamijarulkul P, Arunchai N, Luksamijarulkul S, Kaewboonchoo O. Improving microbial air quality in air-conditioned mass transport buses by opening the bus exhaust ventilation fans. Southeast Asian J Trop Med Public Health 2005 Jul;36(4):1032-1038.
- Bârlean L, Iancu LS, Minea ML, Dãnilã I, Baciu D. Airborne microbial contamination in dental practices in Iasi, Romania. OHDMBSC 2010 Mar;9(1):16-20.
- Luksamijarulkul P, Panya N, Sujirarat D, Thaweboon S. Microbial air quality and standard precaution practice in a hospital dental clinic. J Med Assoc Thai 2009 Dec;92(Suppl 7):S148-S155.
- Harrel SK, Molinari J. Aerosols and splatter in dentistry: a brief review of the literature and infection control implications. J Am Dent Assoc 2004 Apr;135(4):429-437.
- Willeke K, Qian Y, Donnelly J, Grinshpun S, Ulevicius V. Penetration of airborne microorganisms through a surgical mask and a dust/mist respirator. Am Ind Hyg Assoc J 1996 Apr;57(4):348-355.
- Douwes J, Thorne P, Pearce N, Heederik D. Bioaerosol health effects and exposure assessment: progress and prospects. Ann Occup Hyg 2003 Apr;47(3):187-200.
- Graham LM. All I need is the air that I breath: outdoor air quality and asthma. Paediatr Respir Rev 2004;5(Suppl A):S59-S64.
- Fradkin A. Sampling of microbiological contaminants in indoor air. In Taylor JK, edition. Sampling and calibration for atmospheric measurements, ASTM STP 957. West Conshohocken: American Society for Testing and Materials, 1997. p.66-77.
- Larone DH. Medically important fungi: a guide to identification. 3rd edition Washigton DC: American Society of Microbiology Press, 1995.
- Seitz TA. NIOSH indoor air quality investigations 1971-1988. In: Weekes DM, Gammage RB, editors. Proceedings of the Indoor Air Quality, International Symposium; May 23, 1989; Cincinnati, OH. National Institute for Occupational Safety and Health; 1989. p.163-171.
- Sehulster L, Chinn RY; CDC; HICPAC. Guidelines for environmental infection control in health-care facilities. Recommendations of CDC and the Healthcare Infection Control Practices Advisory Committee (HICPAC). MMWR Recomm Rep 2003 Jun;52(RR-10):1-42.
- Siegel JD, Rhinehart E, Jackson M, Chiarello L; Health Care Infection Control Practices Advisory Committee. 2007 Guideline for Isolation Precautions: Preventing Transmission of Infectious Agents in Health Care Settings. Am J Infect Control 2007 Dec;35(10)(Suppl 2):S65-S164.
- Alves DW, Bissell RA. Bacterial pathogens in ambulances: results of unannounced sample collection. Prehosp Emerg Care 2008 Apr-Jun;12(2):218-224.
- Wepler M, Stahl W, von Baum H, Wildermuth S, Dirks B, Georgieff M, et al. Prevalence of nosocomial pathogens in German ambulances: the SEKURE study. Emerg Med J 2015 Feb 24; emermed_2013-202551.
- Andersen BM, Rasch M, Kvist J, Tollefsen T, Lukkassen R, Sandvik L, et al. Floor cleaning: effect on bacteria and organic materials in hospital rooms. J Hosp Infect 2009 Jan;71(1):57-65.
- Nigam Y, Cutter J. A preliminary investigation into bacterial contamination of Welsh emergency ambulances. Emerg Med J 2003 Sep;20(5):479-482.
- Luksamijarulkul P, Aiempradit N, Vatanasomboon P. Microbial contamination on used surgical masks among hospital personnel and microbial air quality in their working wards: A hospital in Bangkok. Oman Med J 2014 Sep; 29(5):346-350.
- Norris TB, McDermott TR, Castenholz RW. The long-term effects of UV exclusion on the microbial composition and photosynthetic competence of bacteria in hot-spring microbial mats. FEMS Microbiol Ecol 2002 Mar;39(3):193-209.
- Vonberg RP, Gastmeier P, Kenneweg B, Holdack-Janssen H, Sohr D, Chaberny IF. The microbiological quality of air improves when using air conditioning systems in cars. BMC Infect Dis 2010;10(10):146.
- World Health Organization. Indoor air quality: biological contaminants. Report on a WHO meeting. WHO Reg Publ Eur Ser 1990;31:1-67.
- Mc Neel SV, Kreutzer RA. Fungi and indoor air quality. Health Environ Dig 1996 Feb;10(2):9-12.
- Gonçalves FL, Bauer H, Cardoso MR, Pukinskas S, Matos D, Melhem M, et al. Indoor and outdoor atmospheric fungal spores in the São Paulo metropolitan area (Brazil): species and numeric concentrations. Int J Biometeorol 2010 Jul;54(4):347-355.
- Luksamijarulkul P, Ratthanakhot Y, Vatanasomboon P. Microbial counts and particulate matter levels in indoor air samples collected from a child home-care center in Bangkok, Thailand. J Med Assoc Thai 2012 Jun;95(Suppl 6):S161-S168.
- Newson R, Strachan D, Corden J, Millington W. Fungal and other spore counts as predictors of admissions for asthma in the Trent region. Occup Environ Med 2000 Nov;57(11):786-792.
- Lowe JJ, Hewlett AL, Iwen PC, Smith PW, Gibbs SG. Evaluation of ambulance decontamination using gaseous chlorine dioxide. Prehosp Emerg Care 2013 Jul-Sep;17(3):401-408.
- Shelton BG, Kirkland KH, Flanders WD, Morris GK. Profiles of airborne fungi in buildings and outdoor environments in the United States. Appl Environ Microbiol 2002 Apr;68(4):1743-1753.
- Nzeako BC, Al-Lamati H, Elsafic A, Al-Jabri M, Al-Balkhair A. Correlation between sedimentation plate and surface swab in the isolation of fungi from the hospital wards. Intl J Microbiol Res 2011;2(2):129-134.
- Zambrano AA, Jones A, Otero P, Ajenjo MC, Labarca JA. Assessment of hospital daily cleaning practices using ATP bioluminescence in a developing country. Braz J Infect Dis 2014 Nov-Dec;18(6):675-677.
- Liebers V, Bachmann D, Franke G, Freundt S, Stubel H, Düser M, et al. Determination of ATP-activity as a useful tool for monitoring microbial load in aqueous humidifier samples. Int J Hyg Environ Health 2015 Mar;218(2):246-253.
- Caputo P, Ferri EN, Girotti S, Gozzi S, Saracino P. Application of luminescent ATP rapid checks at ready-to-eat foods producing plant. Czech J Food Sci 2011 Apr;29(4):382-390.