More people are living longer than ever before. Thus, the health, safety, and quality of life (QoL) of senior citizens have become matters of prime focus in global healthcare. With advanced age, human physiological and functional conditions tend to deteriorate.1 The strength of the muscles that support and balance the body can decrease dramatically after the age of 60. These physiological changes negatively affect older people’s ability to maintain balance and posture, causing them to feel unstable and dizzy, raising their risk of falls.2,3 ‘Balance’ is defined as maintaining the body’s center of gravity within a level of reliance with minimal postural oscillation.4 As the postural control system deteriorates with age, the individual becomes vulnerable to loss of balance (LoB) and physical falls.5 Maintaining postural control is a complex and multifaceted process, and its deterioration severely impacts one’s QoL, increases the fear of falling (FoF) which further raises the risk of LoB.6 A fall, the second most common cause of injury among older people, is defined as a sudden, involuntary LoB followed by an unplanned descent to the ground or lower levels with or without injury.7,8 Much research has been devoted to improve the capacity of the elderly to maintain balance. Early detection and treatment of LoB-related disorders in older people may reduce the risk of falling, mitigate FoF, and improve QoL.9 Rising, LoB and FoF may continue to reduce QoL while also increasing the economic consequences and the elderly
dependency ratio.10–12
There are numerous external and internal causes of falling.13 External causes (about 30%) include unsafe footwear, walking on slick surfaces, and encountering environmental obstacles. Female gender, balance-related diseases, LoB, FoF, and use of medications such as sleeping pills are among the internal causes of falling.3,14 LoB, one of the main causes of falling, is more than just a psychological reaction to past failures. Recent research has focused on the question of which occurs first: falling, LoB, or FoF.15 However, most studies have focused on the experience of falling instead of its etiology, which includes LoB and FoF.16
Higher LoB has been reported among 20–39% of people who have previously fallen.17 LoB has also been reported as a syndrome in the elderly with no history of falling.17–19 The prevalence of FoF in the elderly has been estimated at around 60%.20 LoB reduces a person’s confidence in one’s balance and limit physical activities and later even the ability to perform some activities of daily livings (ADLs).21,22 As the old-age dependency ratio rises, it can strain family and social relationships and result in social isolation.19 The Berg Balance Scale (BBS) is one of the most widely used tools for measuring balance and LoB individuals. BBS is available in two versions, the full version with 14 items (BBS-14) and the newer short version with 9 items (BBS-9). BBS has high validity and reliability in varied patient populations, including those with stroke, Parkinson’s disease, multiple sclerosis, brain damage, etc., and is able to predict the risk of falling.23 Being a short scale, it can be completed quicker than BBS-14 and can be used without the need for special places or facilities.
In Iran, no national study has been conducted among the elderly to determine their balance, LoB, FoF, or frequency of falling. BBS-9 has also not been nationally validated in Iran despite being well-suited for randomized controlled trials (RCTs) and clinical settings. This study sought to address this information gap by identifying and validating the instrumental and psychometric aspects of BBS-9 in older Iranian adults.
Methods
The subjects for this study were sourced from the Farzanegan Daily Caring Foundation (FDCF) in southern Iran, which has 17 500 members over the age of 60. The area under the curve (AUC) index (≥ 0.80), alpha (Type I error) 0.05, beta (Type II error-power) 0.98, and sensitivity and specificity of 90% were used to evaluate Auaisa’s psychometric study (specificity fixed at ≥ 0.85).22 The sample size was calculated to be 9120 participants assuming a 25% dropout rate using PASS software (PASS 15 Power Analysis and Sample Size Software (2017) NCSS, LLC. Kaysville, Utah, USA).24 This sample size was chosen from the FDCF population by entering the names of eligible older participants into Microsoft Excel 2010. Based on the inclusion criteria, each FDCF member was assigned a code. The study sample was then chosen at random from a table.
Participant inclusion criteria comprised: being ≥ 60 years of age, having no effective cognitive impairment as measured by a MoCA score of +26 (range = 0–30), being able to communicate, having willingness to participate in the study, and being a permanent member of FDCF. Exclusion criteria included death, the participant leaving FDCF, and non-participation due to severe illness or unwillingness.
The study was conducted as per the provisions of the Helsinki Convention (2013) and the STROBE checklist. Shiraz University of Medical Sciences Ethics Committee provided the ethical permission (Ref. IR.SUMS.SCHEANUT.REC.1401.019). All participants provided both oral and written informed consent.
A demographic questionnaire collected information such as gender, age, level of education, marital status, chronic illness, ADL, aging in place (AiP), frailty, hospitalization due to falling, and frequency of hospitalization rate (HR) and history of falls in the past pear (HF). Geriatric Depression Scale and Geriatric Anxiety Inventory (GAI) were used to screen for depression and anxiety. Three participants died during the study period, and the data were screened in May 2022.
BBS-14, the original long version of the instrument, is known to have good reliability and validity.25–27 The newer BBS-9 is more recently designed and validated.28 Its nine items depict sitting to standing, transfering, reaching forward with an outstretched arm, retrieving an object from the floor, turning to look behind, turning 360 degrees, standing on one foot, and standing on two feet. The five-option answers ranged from ‘inability’ to ‘ability’ with a total scoring range of 0–36. The highest score = 28, represents a high level of balance. The participants completed the BBS-9 during mid-2022, along with five other instruments (University of California Los Angeles-Loneliness, Frailty-SHARE, Geriatric Depression Index, GAI, and AiP).
After obtaining permission from the designers of BBS-9, the instrument was translated to Persian, back-translated to English, and validated using the World Health Organization’s protocol. Two independent Persian translators translated the scale to Persian using this protocol. The BBS-9 was then evaluated, and an agreed-upon version was achieved through a meeting with translators. Face validity of the questionnaire was investigated during an interview with 10 literate Iranian senior citizens (having minimum bachelor’s degrees). They were asked to evaluate the difficulty level, ambiguity, and appropriateness of each item. They were also asked to submit suggestions to resolve the issues they found. As per the Lawshe table,29 for an eight-item instrument, using 10 evaluators is sufficient for an acceptable content validity ratio (CVR) limit of 0.60. The CVR and then the content validity index (CVI) were used to assess the CV after confirming the face validity. The mean validity index of the tool’s overall content determines the overall CVI of a tool.30 Accordingly, we arrived at a CVI of ≥ 92% for each item and 94% for the entire scale. After proving the content and face validity, a copy of the questionnaire was sent to each translator for back-translation to English. These English versions were obtained under the supervision of two academic members of the Shiraz University of Medical Sciences, and a single version with the greatest alignment with the original version was extracted. The original designer was then contacted for final approval. After these procedures, the finalized Persian BBS-9 and other tools were administered to the selected 9117 male and female participants.
The exploratory factor analysis (EFA) technique was used in the first stage after entering the data into ISPSS windows (IBM Corp. Released 2021. IBM SPSS Statistics for Windows, Version 28.0. Armonk, NY: IBM Corp.) to determine the construct validity and identify factor scales using Varimax and Quartimax rotation and scree plot.31 The assumptions were examined before using the method EFA, including the Kaiser-Meyer-Olkin test for sample size adequacy, data normality, and Bartlett’s test of sphericity. The identity matrix was then compared to the observed correlation matrix.32 In the second stage, the model fit indices were examined using IBM-Amos software (Arbuckle, J. L. (2016). Amos (Version 24.0) [Computer Program]. Chicago: SPSS) and principal component analysis (PCA). In the third stage, the internal consistency of BBS-9 was tested using McDonald’s omega, Cronbach’s alpha, and Pearson correlation. The intraclass correlation coefficient (ICC) was also examined to assess the instrument’s internal reliability. We used the epsilon square to estimate effect size measures, which has a similar interpretation to Cohen’s d and Eta square. Finally, the BBS-9 cut-off points were determined using receiver operating characteristics (ROC) analysis, abs (sensitivity–specificity) (DIFF), Youden’s J, and D value.
Results
The participants (N = 9117) had a mean age of 64.3±2.45. The majority (54.1%) were female. Almost half (47.7%) had no formal education. Most participants (72.4%) lived alone, 43.0% were widowed, 92.9% needed help with ADL, and 93.0% had sustained falls in the previous two years. The participants’ mean HR caused by falling was 4.1±1.5; wherein 9.4% had ≥ 4 falls per year. Both sexes had similar rates of HR (p = 0.075). ADL assistance was the primary requirement for 93.0% of women and for 56.1% of the entire cohort. The vast majority (97.0%) of participants were beneficiaries of the pension system. The mean BBS-9 score for the cohort was 22.8±3.1 (range = 0–36). BBS-9 scores were higher for the oldest participants who had a mean score of 27.7±0.7. The participants had a mean score of 2.5±1.6 (range = 0–5) for anxiety and 61.6±7.6 (range = 20–80) for loneliness. Analysis of variance results revealed the effect size of each demographic and health variable on the total score of BBS-9.
The effect size was 14.4% for AiP, 14.5% for age, 14.0% for HR, 11.2% for HF, 13.9% for loneliness, 11.0% for the need for ADL, 13.8% for frailty, 10.1% for depression, and 13.5% for the sense of anxiety [Table 1]. There was no statistically significant difference between the scores of women and men (p ≥ 0.050).
Table 1: The one-way ANOVA for health and demographic factors (N = 9117; p ≤ 0.05).
|
AiP
|
Between groups
|
70.2 (8.3)
|
3913.331
|
78
|
50.171
|
5.313
|
0.144
|
0.001
|
|
Within groups
|
|
85 347.115
|
9038
|
9.443
|
|
|
|
|
Total
|
|
89 260.445
|
9116
|
|
|
|
|
|
Age, years
|
Between groups
|
64.3 (24.5)
|
3984.185
|
40
|
99.605
|
10.601
|
0.145
|
0.001
|
|
Within groups
|
|
85 276.260
|
9076
|
9.396
|
|
|
|
|
Total
|
|
89 260.445
|
9116
|
|
|
|
|
|
HR
|
Between groups
|
4.1 (1.5)
|
3526.702
|
7
|
503.815
|
53.529
|
0.140
|
< 0.001
|
|
Within groups
|
|
85 733.743
|
9109
|
9.412
|
|
|
|
|
Total
|
|
89 260.445
|
9116
|
|
|
|
|
|
HF
|
Between groups
|
93.7%a
|
1068.858
|
1
|
1068.858
|
110.471
|
0.112
|
0.001
|
|
Within groups
|
|
88 191.587
|
9115
|
9.675
|
|
|
|
|
Total
|
|
89 260.445
|
9116
|
|
|
|
|
|
Need for ADL assistance
|
Between groups
|
16.7 (2.6)
|
927.779
|
1
|
927.779
|
95.737
|
0.110
|
0.001
|
|
Within groups
|
|
88 332.666
|
9115
|
9.691
|
|
|
|
|
Total
|
|
89 260.445
|
9116
|
|
|
|
|
|
Loneliness
|
Between groups
|
61.6 (7.6)
|
3471.540
|
31
|
111.985
|
11.859
|
0.139
|
0.001
|
|
Within groups
|
|
85 788.905
|
9085
|
9.443
|
|
|
|
|
Total
|
|
89 260.445
|
9116
|
|
|
|
|
|
Anxiety
|
Between groups
|
2.5 (0.5)
|
3101.821
|
5
|
620.364
|
62.602
|
0.135
|
0.001
|
|
Within groups
|
|
86 158.624
|
9111
|
9.457
|
|
|
|
|
Total
|
|
89 260.445
|
9116
|
|
|
|
|
|
Depression
|
Between groups
|
1.9 (1.4)
|
97.585
|
4
|
24.396
|
2.493
|
0.101
|
0.041
|
|
Within groups
|
|
89 162.860
|
9112
|
9.785
|
|
|
|
|
Total
|
|
89 260.445
|
9116
|
|
|
|
|
|
Frailty
|
Between groups
|
2.9 (1.4)
|
3380.330
|
4
|
845.082
|
89.664
|
0.138
|
< 0.001
|
|
Within groups
|
|
85 880.116
|
9112
|
9.425
|
|
|
|
aFrequency (%) of 4 time and more of falling in the past year. ANOVA: Analysis of variance; df: degree of freedom; F: F statistical test; HR: hospitalization rate;
HF: history of falls in the past year; AiP: aging in place; ADL: activities of daily living.
In the current study, the Skewness score ranged -1.5 to +1.5, with Fidell and Tabachnick (2001)33 defining an acceptable amount as < 2, indicating the data’s normality of distribution. The correlation matrix represented the majority of correlations as > 0.52. Furthermore, the Kaiser-Meyer-Olkin value was 0.507 (p < 0.001), greater than the recommended threshold by Kaiser, 1974.34 To test the null hypothesis of correlation matrix being an identity matrix, Bartlett’s test of sphericity was run, and the results were acceptable (approx. chi-square = 39.792; p = 0.305). EFA was used to assess the construct validity of BBS, and four extracting models were used: generalized least squares, unweighted least squares, and maximum likelihood with equamax and varimax rotation. The solution could not be rotated because only one component was extracted. Two components were extracted using PCA with five rotation methods, namely quartimax, varimax, equamax, oblimin, and promax in Kaiser normalization. The eigenvalue was 99.6, with 67.6% of the variance explained. The items’ mean scores for factors 1 and 2 and communalities were 0.474, 0.401, and 1.000, respectively. Factor 1 included statistical balance items, such as 1, 2, 3, 5, 6, and 8, whereas factor 2 included dynamic balance items, such as 4, 7, and 9 (transfer, turning to look behind, and turning 360°).
A confirmatory factor analysis was then performed using AMOS-24 software to evaluate the 2-factor structure presented in the previous step.18 The factor structure of BBS-9 for the obtained 1-factor model was good, as shown in Table 2 when the main goodness of fit indices was considered. Furthermore, the chi-square was statistically significant (p < 0.001), and the root mean square error of approximation (RMSEA) was < 0.05. The adjusted goodness of fit index (AGFI) was 0.90, with a relative chi-square of 107.27, Tucker–Lewis index of 0.91, incremental fit index of 0.91, NNFI of 0.90, confirmatory fit index. of 0.92, and GFI of 0.92 (p = 0.001). Furr (2011) suggested that the confirmatory factor analysis fit indices have standardized loadings of ≥ 0.90.19 The GFIs for the two-factor model is slightly lower than the good fit values (RMSEA ≥ 0.05), and thus cannot be considered acceptable.
Table 2: The Goodness of the Extracted Model’s Fit Indices for the 9-Item Berg Balance Scale (BBS-9).
|
1-factor
|
107.27
|
8
|
13.408
|
0.001
|
0.031
|
0.90
|
0.91
|
0.91
|
0.90
|
0.90
|
0.92
|
RMSEA: root mean square error of approximation; AGFI: adjusted goodness of fit index; TLI: Tucker–Lewis index; IFI: incremental fit index;
NNFI: Non-normed fit index GFI: goodness of fit index; CFI: confirmatory fit index.
Figure 1 illustrates the final explained model in a one-factor format.
BBS.1 … BBS.9 in boxes: Each box represents a specific item in the BBS-9 questionnaire. One-way arrows show the factor load of each item in explaining the total score of BBS. Score 1 means 100% predictive power. Two-sided arrows indicate the mutual correlation of items with each other. Score 1 means the similarity and homogeneity of two items together.
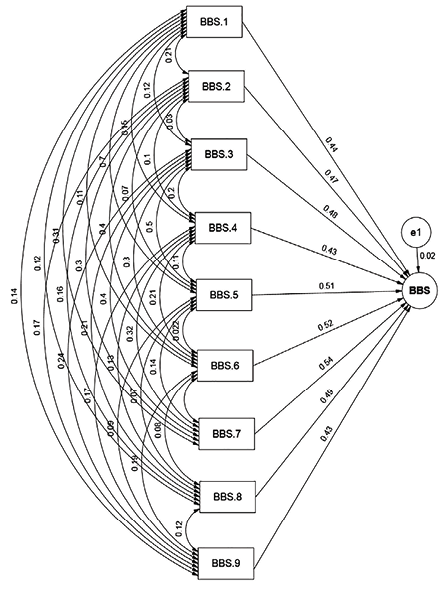 Figure 1: Path diagram for the confirmatory factor analysis of individual components of 9-Item Berg Balance Scale (BBS-9).
Table 3 compares the convergent validity of BBS-9 with the Iranian versions of University California Los Angeles-Loneliness (0.83), GAI (0.86), AiP (-0.15), and Frailty-SHARE (0.94) (p < 0.001, 2-tailed) which were concurrently administered along with BBS-9 to the study participants. The nine items had moderate to high internal consistency between them and the mean score of internal consistency was 0.74. The significance level for all path coefficients was set at
p ≤ 0.010. The BBS-9 scale demonstrated exceptional dependability. Cronbach’s alpha was 0.87, with a McDonald’s omega of 0.86 (p ≤ 0.001), Fleiss Kappa of 0.71, ICC of 0.85, and weighted kappa of 0.72 for the entire scale.
Table 3: The AUC, sensitivity, specificity, and Youden’s index for possible cut-off points of the 9-Item Berg Balance Scale (BBS-9).
|
BBS (Men)
|
0.637
|
0.616
|
0.657
|
22.82 (3.1)
|
0.001
|
23.0
|
0.743
|
0.692
|
0.435
|
0.352
|
0.051
|
0.051
|
-0.074
|
|
BBS (Women)
|
0.650
|
0.631
|
0.668
|
22.86 (3.2)
|
< 0.001
|
22.0
|
0.641
|
0.665
|
0.306
|
0.471
|
0.024
|
-0.024
|
0.036
|
|
ADL help not needed
|
0.634
|
0.591
|
0.677
|
21.68 (3.1)
|
0.007
|
20.5
|
0.651
|
0.688
|
0.339
|
0.446
|
0.037
|
-0.037
|
0.054
|
|
ADL help needed
|
0.651
|
0.639
|
0.662
|
22.93 (3.1)
|
< 0.001
|
15.5
|
0.631
|
0.950
|
0.581
|
0.372
|
0.319
|
-0.319
|
0.336
|
|
HF (No)
|
0.658
|
0.508
|
0.609
|
21.59 (3.0)
|
< 0.001
|
17.5
|
0.589
|
0.931
|
0.520
|
0.416
|
0.342
|
-0.342
|
0.367
|
|
HF (Yes)
|
0.651
|
0.639
|
0.663
|
22.93 (3.1)
|
< 0.001
|
15.5
|
0.556
|
0.996
|
0.552
|
0.444
|
0.440
|
-0.440
|
0.442
|
|
HR (≤ 3)
|
0.633
|
0.616
|
0.750
|
22.09 (3.1)
|
0.001
|
20.5
|
0.467
|
0.721
|
0.188
|
0.611
|
0.254
|
-0.254
|
0.352
|
aTwo-sided chi-squared test, p ≤ 0.05. Independent-group area difference under the receiver operating characteristic curve ≤ 0.015 (p ≤ 0.001).
AUC: area under curve; CI: confidence interval; DIFF: abs (sensitivity–specificity); D value or K-index: sqrt ((1-sensitivity)2 + (1-specificity) 2), HF: history of falling experience in the past two year; ADL: activity daily living; HR: hospitalization rate per year due to falling: LR + & LR -: Positive & negative likelihood ratios.
The K-means cluster analysis is an algorithm that divides participants into clusters based on similarity. It can be used to validate assumptions about the validity of instruments while building items, as well as to identify unknown components in complex data sets.35 Using K-means clustering for total BBS scores (ranging from 0 to 36), two clusters were identified, with initial cluster centers of 26 and 21, respectively, for cluster numbers 1 and 2, and the distance between final cluster centers was 5.07. The number of cases in each cluster was 3809 for cluster 1 and 53.8 for cluster 2. The silhouette measure of clustering cohesion (closeness) and separation (detachment) was 0.671. This is a measure of the overall goodness-of-fit for the clustering and is based on the average distances between the nodes. It can range from -1 to +1, with a silhouette measure < 0.20 indicating poor solution quality, a measure between 0.20 and 0.50 indicating a fair solution, and a measure > 0.50 indicating a good solution.36
Table 3 shows the area under the ROC curve (AUC), specificity, sensitivity, and cut-off points for BBS-9. The cut-off points for the best differentiated with and without FoF in women and men, as shown, were 15.5 and 15, respectively. The Youden’s J, D value (Euclidean distance), and DIFF indices are used to determine the best cut-off point for the tests and to evaluate biomarker effectiveness.37 The optimal cut-point value is indicated by Yuoden’s J close to 1 and D value and DIFF close to 0. The estimated cut-off points are applicable, according to Table 3.38,39
The independent-group area differences for men and women, with/without ADL, HF, and HR (yes and no) (calculated using the ROC curve results between the groups) yielded -0.314, -0.204, 0.201, and -0.322, respectively, according to the ROC curve, and were statistically significant (p < 0.001). According to Zweig and Campbell (1993), the groups had perfect discrimination (no overlap in the two distributions), and Campbell (1993), and the ROC plot passed through the upper left corner.40 It was suggested that the BBS, or the specific cutting points of each group, be considered separately, along with the two groups’ strong discrimination.
Discussion
The psychometric features of the BBS-9 and its cut-off points for falling among aged individuals in Iran have been investigated in this study. This work had acceptable internal consistency, accuracy, reliability, structure, and convergent validity (p ≤ 0.050). Except for sex (p > 0.300) (p ≤ 0.001), the acceptability results represented the fixed effects of loneliness, anxiety, frailty, AiP, age per year, and HR on aging FoF with an effect size of > 0.130. The items were analyzed using two models: one-factor and two-factor with Eigenvalues close to one. Furthermore, the extracted models included PCA, unweighted least squares, GLS, and maximum likelihood. This one-factor model was found to be the best by fit indices (mean of indices ≥ 0.80) for the 2-factor model and the RMSEA = 0.031 (p = 0.001).
The results also demonstrated high internal consistency of BBS-9 (similar to previous studies elsewhere with the longer BBS-14) showing acceptable inter-item correlation with McDonald’s Omega at 0.86 and ICC at 0.85. Good consistency was found between the results and the original version of BBS for assessing inter-rater and test-retest reliability, with CVI-CVR ≥ 0.6. It is also accurate enough for use in clinical trials and studies, with an acceptable SEM. Furthermore, investigating convergent validity revealed a moderate to high correlation between the total score of BBS, which was consistent with other instruments in similar studies such as Frailty-SHARE41,42 and GAI,43,44 and UCLA-Loneliness45–47 except for Geriatric Depression Scale, which was not statistically significant (p ≥ 0.05). The ROC analysis results revealed that the total BBS score has adequate discriminative validity to classify various demographic levels and health statuses (male/female, with/without ADL, HF, and HR). The results revealed that the cut-off point for older men and women was 23.0 and 22.0, respectively. From the need for ADL, with 15.5, 20.5 represented no need for ADL. Furthermore, the cut-off point of 15.5 distinguishes ‘having HF’ from ‘having no HF’ with 17.5 and 16.5, HR (≥ 4) from HR (≤ 3) with 20.5 (all with a sensitivity of < 0.750). By recognizing features such as the LoB and FoF levels, researchers and clinicians can use these cut-off points to design personalized treatment plans and RCTs for the elderly.
Most older people with LoB do not receive proper diagnosis or treatment because their LoB levels are not accurately measured, causing them great suffering. Complete identification of LoB and FoF and taking remedial actions can significantly improve their QoL, self-reliance, and productivity.
Our study had limitations. Our subjects were mostly ≤ 80 years of age, which mostly excluded the very old who may be more vulnerable to falling. Furthermore, age classification was not taken into account in the inclusion criteria. Thus, caution is advised when generalizing the current work’s results to other populations and RCTs, particularly when it comes to the LoB cut-off point score.
Future research needs to include significant proportions of subjects aged > 80 as well as institutionalized older adults. In our study, women were much more in need of ADL assistance than men. Future research should focus on older women’s higher prevalence of falling and need for ADL assistance than men and generate specific cutting points and applications of this tool in different sub-groups of older women, such as rural-urban and older women with or without cognitive impairment. Furthermore, to administer BBS instrument more easily to rural populations in Iran, even shorter versions of BBS (with 5–7 items) are worth considering.
Conclusion
The psychometric properties of the newly developed Persian version of the BBS-9 were investigated in this study. It was found to be a reliable and valid instrument for measuring the LoB and associated problems such as FoF among older Iranian adults in clinical and community settings. This scale is also capable of assessing and categorizing the severity of LoB and FoF in an individual. More research is needed to validate BBS-9 in Iran’s other subcultures, especially in rural areas.
Disclosure
The authors declared no conflicts of interest. No funding was received for this study.
references
- 1. Wu H, Wei Y, Miao X, Li X, Feng Y, Yuan Z, et al. Characteristics of balance performance in the Chinese elderly by age and gender. BMC Geriatr 2021 Oct 25;21(1):596.
- 2. Paolucci T, Pezzi L, La Verde R, Latessa PM, Bellomo RG, Saggini R. The focal mechanical vibration for balance improvement in elderly - a systematic review. Clin Interv Aging 2021 Dec 2;16:2009-2021.
- 3. Meseguer-Henarejos AB, Rubio-Aparicio M, López-Pina JA, Carles-Hernández R, Gómez-Conesa A. Characteristics that affect score reliability in the berg balance scale: a meta-analytic reliability generalization study. Eur J Phys Rehabil Med 2019 Oct;55(5):570-584.
- 4. Shumway-Cook A, Guralnik JM, Phillips CL, Coppin AK, Ciol MA, Bandinelli S, et al. Age-associated declines in complex walking task performance: the walking InCHIANTI toolkit. J Am Geriatr Soc 2007 Jan;55(1):58-65.
- 5. Park SH, Lee YS. The diagnostic accuracy of the berg balance scale in predicting falls. Western Journal of Nursing Research 2017 Nov;39(11):1502-1525.
- 6. Alghadir AH, Al-Eisa ES, Anwer S, Sarkar B. Reliability, validity, and responsiveness of three scales for measuring balance in patients with chronic stroke. BMC Neurology 2018 Dec;18(1):1-7.
- 7. Rubega M, Formaggio E, Di Marco R, Bertuccelli M, Tortora S, Menegatti E, et al. Cortical correlates in upright dynamic and static balance in the elderly. Sci Rep 2021 Jul 8;11(1):14132.
- 8. Xiao Y, Luo Q, Yu Y, Cao B, Wu M, Luo Y, et al. Effect of baduanjin on the fall and balance function in middle-aged and elderly people: a protocol for systematic review and meta-analysis. Medicine (Baltimore) 2021 Sep;100(37):e27250.
- 9. Vogelsang EM, Raymo JM, Liang J, Kobayashi E, Fukaya T. Population aging and health trajectories at older ages. J Gerontol B Psychol Sci Soc Sci 2017 Oct;72(6):1111-1112.
- 10. Montero-Odasso M, van der Velde N, Alexander NB, Becker C, Blain H, Camicioli R, et al; Task Force on Global Guidelines for Falls in Older Adults. New horizons in falls prevention and management for older adults: a global initiative. Age Ageing 2021 Sep;50(5):1499-1507.
- 11. Nørgaard JE, Jorgensen MG, Ryg J, Andreasen J, Danielsen MB, Steiner DK, et al. Effects of gait adaptability training on falls and fall-related fractures in older adults: a systematic review and meta-analysis. Age Ageing 2021 Nov;50(6):1914-1924.
- 12. Roberts HJ, Johnson KM, Sullivan JE, Hoppes CW. Fear of falling avoidance behavior is associated with balance and dynamic gait performance in community-dwelling older adults: a cross-sectional study. J Geriatr Phys Ther 2022 Apr:10-519.
- 13. Shibata M, Isoda A, Ogasawara T, Satio K, Inoue Y. Verification of the causes of and countermeasures for falls using fall assessment score sheets in a municipal hospital. Journal of Gerontology and Geriatrics 2022;70:40-49.
- 14. Womack JA, Murphy TE, Bathulapalli H, Smith A, Bates J, Jarad S, et al. Serious falls in middle-aged veterans: development and validation of a predictive risk model. J Am Geriatr Soc 2020 Dec;68(12):2847-2854.
- 15. Drummond FM, Lourenço RA, Lopes CS. Association between fear of falling and spatial and temporal parameters of gait in older adults: the FIBRA-RJ study. Eur Geriatr Med 2022 Apr;13(2):407-413.
- 16. Schroeder O, Schroeder J, Fitschen-Oestern S, Besch L, Seekamp A. Effectiveness of autonomous home hazard reduction on fear of falling in community-dwelling older women. J Am Geriatr Soc 2022 Jun;70(6):1754-1763.
- 17. Aoyagi GA, Pinto RZ, Lemes ÍR, Pastre CM, Eto BY, Faria MS, et al. Fear of falling does not predict self-reported physical activity: an observational study with community-dwelling older adults. Physiotherapy 2022 Sep;116:50-57.
- 18. Scheffer AC, Schuurmans MJ, van Dijk N, van der Hooft T, de Rooij SE. Fear of falling: measurement strategy, prevalence, risk factors and consequences among older persons. Age Ageing 2008 Jan;37(1):19-24.
- 19. Okoye EC, Onwuakagba IU, Akile CC, Okonkwo UP, Akosile CO, Mgbeojedo UG, et al. Social support, general self-efficacy, fear of falling, and physical activity among older adults in a middle-income country. Gerontol Geriatr Med 2022 Apr;8:23337214221097750.
- 20. Makino K, Makizako H, Doi T, Tsutsumimoto K, Hotta R, Nakakubo S, et al. Impact of fear of falling and fall history on disability incidence among older adults: prospective cohort study. Int J Geriatr Psychiatry 2018 Apr;33(4):658-662.
- 21. Brodowski H, Strutz N, Mueller-Werdan U, Kiselev J. Categorizing fear of falling using the survey of activities and fear of falling in the elderly questionnaire in a cohort of hospitalized older adults: a cross-sectional design. Int J Nurs Stud 2022 Feb;126:104152.
- 22. Stanmore EK, Mavroeidi A, de Jong LD, Skelton DA, Sutton CJ, Benedetto V, et al. The effectiveness and cost-effectiveness of strength and balance Exergames to reduce falls risk for people aged 55 years and older in UK assisted living facilities: a multi-centre, cluster randomised controlled trial. BMC Med 2019 Feb;17(1):49.
- 23. Miranda-Cantellops N, Tiu TK. Berg balance testing. In: StatPearls. Treasure Island (FL): StatPearls Publishing; 2022.
- 24. Obuchowski NA, McClish DK. Sample size determination for diagnostic accuracy studies involving binormal ROC curve indices. Stat Med 1997 Jul;16(13):1529-1542.
- 25. de Carvalho Fonseca RG, Silva AM, Teixeira LF, Silva VR, Dos Reis LM, Silva Santos AT. Effect of the auricular acupoint associated with physical exercise in elderly people: a randomized clinical test. J Acupunct Meridian Stud 2018 Aug;11(4):137-144.
- 26. Hohtari-Kivimäki U, Salminen M, Vahlberg T, Kivelä SL. Short berg balance scale - correlation to static and dynamic balance and applicability among the aged. Aging Clin Exp Res 2012 Feb;24(1):42-46.
- 27. Hohtari-Kivimäki U, Salminen M, Vahlberg T, Kivelä SL. Predicting value of nine-item berg balance scale among the aged: a 3-year prospective follow-up study. Exp Aging Res 2016;42(2):151-160.
- 28. Kashani VO, Salmanzade M, Bahrami L. Determination of validity and reliability of the Persian version of the 9-item berg balance scale in elderly people. Koomesh 2018 Jan;20(1):25-33.
- 29. Mantas J. Requirement Analysis for an Intelligent Warning System to Alarm the Rapid Response Team Prior to Patient Deterioration. Advances in Informatics, Management and Technology in Healthcare. 2022 Aug 5;295:5.
- Dias N, Kempen GI, Todd CJ, Beyer N, Freiberger E, Piot-Ziegler C, et al. [The German version of the falls efficacy scale-international version (FES-I)]. Z Gerontol Geriatr 2006 Aug;39(4):297-300.
- 30. Lawshe CH. A quantitative approach to content validity 1. Person Psychol 1975 Dec;28(4):563-575.
- 31. Cattell RB. The scree test for the number of factors. Multivariate Behav Res 1966 Apr;1(2):245-276.
- Tabachnick BG, Fidell LS. Using multivariate statistics. Allyn & Bacon. Needham Heights, MA. 2001.
- Bingham KS, Neufeld NH, Alexopoulos GS, Marino P, Mulsant BH, Rothschild AJ, Voineskos AN, Whyte EM, Meyers BS, Flint AJ. Factor analysis of the CORE measure of psychomotor disturbance in psychotic depression: Findings from the STOP-PD II study. Psychiatry Research. 2022 Aug 1;314:114648.
- Cinaroglu S. Integrated k-means clustering with data envelopment analysis of public hospital efficiency. Health Care Manag Sci 2020 Sep;23(3):325-338.
- 33. Benassi M, Garofalo S, Ambrosini F, Sant’Angelo RP, Raggini R, De Paoli G, et al. Using two-step cluster analysis and latent class cluster analysis to classify the cognitive heterogeneity of cross-diagnostic psychiatric inpatients. Front Psychol 2020 Jun;11:1085.
- 34. Furr M. Scale construction and psychometrics for social and personality psychology. SAGE Publications Ltd; 2011.
- 35. Nahm FS. Receiver operating characteristic curve: overview and practical use for clinicians. Korean J Anesthesiol 2022 Feb;75(1):25-36.
- 36. Larner AJ. Defining ‘optimal’ test cut-off using global test metrics: evidence from a cognitive screening instrument. Neurodegener Dis Manag 2020 Aug;10(4):223-230.
- 37. Zhou XH, McClish DK, Obuchowski NA. Statistical methods in diagnostic medicine. John Wiley & Sons; 2009.
- 38. Honda H, Ashizawa R, Kiriyama K, Take K, Hirase T, Arizono S, et al. Chronic pain in the frail elderly mediates sleep disorders and influences falls. Arch Gerontol Geriatr 2022 Mar-Apr;99:104582.
- 39. Argenta C, Zanatta EA, Adamy EK, Lucena AF. Nursing outcomes and interventions associated with the nursing diagnoses: risk for or actual frail elderly syndrome. Int J Nurs Knowl 2022 Oct;33(4):270-279.
- 40. Stasi S, Tsekoura M, Gliatis J, Sakellari V. Motor control and ergonomic intervention home-based program: a pilot trial performed in the framework of the motor control home ergonomics elderlies’ prevention of falls (McHeELP) project. Cureus 2021 Apr;13(4):e14336.
- 41. Estrêla AT, Machin R. The body in old age and its relationships with falls from the narrative of elderlies. Cien Saude Colet 2021 Nov;26(11):5681-5690.
- 42. Manchana V. Fall risk, a growing burden of physical injury and mental health among seniors: pandemic of fears, anxieties, and loneliness in later life (FALL). Academia Letters; 2021.
- 43. Somes J. The loneliness of aging. J Emerg Nurs 2021 May;47(3):469-475.
- 44. Petersen N, König HH, Hajek A. The onset of falls and its effects on perceived social exclusion and loneliness. Evidence from a nationally representative longitudinal study. Arch Gerontol Geriatr 2022 May-Jun;100:104622.