Annually, approximately 15 million infants are born preterm, and the numbers continue to increase. An estimated one million children die every year from preterm birth complications, making it the leading cause of under-five child mortality.1
During the third trimester of pregnancy, insufficient nutrition during this crucial period of brain and lung development and size and weight growth can lead to irreversible negative outcomes. Poor postnatal growth and weight gain in preterm infants is a major health problem across the world.2 In very low birth weight (VLBW) infants, these vital developmental processes usually take place in neonatal intensive care unit (NICU) environments.3 Several studies have shown that neurodevelopment in VLBW is dependent on early gains in fat-free body mass and accelerated linear growth.4 Therefore, poor nutritional support during the NICU stay of preterm infants is often related to diminished neurocognitive function, followed by poor immediate and long-term developmental outcomes.5
Evidence suggests that breastmilk, due to its distinctive nutritional and functional benefits, is the best form of nutrition and should be regarded as the primary source of nutrition for all infants, including both term and preterm infants.6 Breast milk has undebatable short- and long-term advantages due to its excellent composition of multiple nutrient-rich components, including hormonal, enzymatic, anti-infective, trophic and growth factors, as well as a myriad of bioactive proteins, proven to be beneficial for neurocognitive development.7 These factors also offer critical protection against the multitude of preterm risks and problems, such as bronchopulmonary dysplasia (BPD), retinopathy of prematurity (ROP), hyaline membrane disease, and necrotizing enterocolitis (NEC).8–11 However, while preterm breast milk has an altered macronutrient composition of higher protein and fat that better supports premature infants compared to term breast milk, it still lacks adequate nourishment when given at the usual feeding volumes.12,13
Preterm infants typically require high volumes and variable nutrients because they miss the critical period in the third trimester when the placental transfer of nutrients makes reserves to be used in the postnatal period. Due to their specialized nutritional needs and the risk of brain impairment, nutrient fortification of milk is often necessary and recommended prior to exclusively breastfeeding.14 Human milk fortification, since being introduced in the 1980s, has become part of the standard nutritional supplement practice in most NICUs around the world.15,16 A meta-analysis studying the use of preterm formula (PF) compared to donor breast milk for feeding preterm infants showed that formula-fed infants had higher in-hospital rates of weight gain, linear growth, and head circumference growth. However, there is also an increased risk of NEC and feed-intolerance in formula-fed infants.17,18 Over time, the quality and methods of fortification have become more advanced, with ‘adjustable’ and ‘targeted’ individualized fortification methods becoming the optimal practice over ‘standard’ fortification methods.19 The focus of fortification is to elevate and optimize the concentration of nutrients to meet preterm infants’ nutritional requirements at proposed feeding volumes.15
In Oman, a rapid shift in fertility rates from younger women to older women aged 35 to 49 years, who have a higher risk of gestational complications, has resulted in a rise in the preterm birth rate.20 It is important to consider and analyze the healthcare and nutritional practices of NICUs in Oman because prematurity and its complications are one of the leading causes of neonatal deaths.21 At the NICU in Sultan Qaboos University Hospital (SQUH) in Oman, human milk fortifier (HMF) was not available prior to 2018. For years, expressed breast milk (EBM) was fortified using a commercially available PF powder. However, in November 2018, HMF was introduced and replaced the previous practice of using PF powder for the fortification of EBM. The objective of this study was to evaluate and compare the relative effects and advantages of these two methods of EBM fortification in this tertiary healthcare setting.
Methods
Oman is a developing country with universal free healthcare services for all Omani citizens. The healthcare system is organized into three tiers: 1) primary medical care through local health centers, 2) secondary medical care through regional referral hospitals, and 3) tertiary care through national referral hospitals.22 SQUH is a major national referral hospital and academic center in Oman, with high admission rates for high-risk pregnancies, with their associated post-natal complications and neonatal diseases. This retrospective cohort study was conducted in the NICU of SQUH, which is a level III NICU with an average delivery rate of 5000/year.23 Each unit in the NICU team includes the neonatologist, residents, and junior physicians, all of whom round daily, staff nurses, and a dietician who reviews each patient and provides recommendations weekly.
At SQUH’s NICU, preterm infants of < 32 weeks’ gestational age or VLBW (< 1500 g) are started on starter total parenteral nutrition (TPN) on day one of life at a total fluid intake of 80 mL/kg/day. On day two of life, they are started on custom-made TPN. Enteral feeds are introduced once the baby is clinically stable during the first few days of life and progressed as per the individual unit feeding protocol. Fluid intake is documented on a daily basis by nurses, then reviewed by physicians and progressed based on fluid balance and serum sodium (Na) levels, until reaching and maintained at 150 mL/kg/day. Fortification of breastmilk is commenced once total enteral feed volume reaches 120–150 mL/kg/day. Before November 2018, EBM fortification was performed using a commercially available PF powder, using a locally available recipe to make 22, 24, 27, and 30 Kcal/oz (= 0.74, 0.81, 0.91, and 1.01 Kcal/mL) concentrations. After November 2018, HMF was made available for routine EBM fortification. The HMF starts at 22 Kcal/oz (0.74 Kcal/mL) (1 sachet/50 mL of EBM), progressing after 48 hours to 24 Kcal/oz (81 Kcal/mL) (2 sachets/50 mL of EBM) and, if necessary, increased to 26 Kcal/oz (0.88 Kcal/mL) (1 sachet/20 mL of EBM). Additional sources of calories, e.g., medium chain triglycerides (MCT) oil or protein powder, may be added for those infants with suboptimal weight gain despite maximum standard EBM fortification. Once the baby is fed on demand, the calorie concentrations are changed to 24 kcal/oz, usually a few days before discharge. Intake output and growth parameter charting were monitored and recorded daily. Basic laboratory evaluations were done weekly unless there was a need for emergent investigations.
Eligible infants were preterm infants (< 32 weeks’ gestation) or VLBW infants (< 1500 grams), admitted to the SQUH NICU on two different assessment occasions; January to December 2016 (cohort 1: PF powder-fortified EBM cohort) and November 2018 to December 2019 (cohort 2: HMF-fortified EBM cohort). Neonates were excluded if they died before discharge, had palliative care status, were exclusively fed formula, or had chromosomal anomalies.
The primary outcomes were growth rates [weight (Wt: g/kg/day), height (Lt: cm/week) and head circumference (HC; cm/week)]. These were measured over three weekly periods following the commencement of fortification (i.e. P1: week one post-fortification, P2: between week one and two post-fortification, P3: between week two and three post-fortification). Discharge growth parameters were plotted against Fenton growth chart and categorized to < 10th centile, 10–50th centile, 50–90th centile, and > 90th centile.
Secondary outcomes were weekly levels of Na, calcium (Ca), phosphate (PO4), alkaline phosphatase (ALP), albumin, and urea, episodes of ‘feeding intolerance’ (defined as any episode of vomiting, abdominal distension, increased gastric residual volume resulting in holding at least one feed, or keeping on ‘nil per os’ (NPO) orders), NEC, use of other adjunctive fortifications (MCT oil, protein powder), post-conceptional age (PCA) at discharge (in weeks), and length of stay (LOS). Factors related to weight gain velocity (g/kg/day) and the occurrence of NEC were also assessed.
The patients’ electronic charts were reviewed, and a predefined data set was collected for each patient. Categories included gestational age, birth growth parameters, weight before starting fortification (W0), weekly growth parameters for three weeks after starting fortification and at discharge, energy intake through feeds, weekly electrolytes (Na, Ca, PO4, albumin, ALP, and urea), and diagnosis of NEC and its severity according to Bell’s staging,24 BPD and its severity according to National Institute of Child Health and Human Development classification,25 culture-positive sepsis, ROP and its severity according to International Classification of Retinopathy of Prematurity staging,26 other adjunctive fortifications used (e.g., MCT oil or protein fortifier), discharge growth parameters, discharge PCA, and LOS. Each patient received a serial code. Data files were password encrypted to ensure data security, and access was restricted to the investigators.
Analysis was performed using IBM SPSS Statistics 26.0 (IBM Corp. Released 2019. IBM SPSS Statistics for Windows, Version 26.0. Armonk, NY: IBM Corp.). Normally distributed continuous variables are expressed as mean±SD and non-normal variables are expressed as the median and interquartile range. Categorical variables are shown as numbers and percentages. The two cohorts of the study were compared in baseline and primary and secondary outcome variables. The chi-square test was used to test the significance of the association between categorical variables, normally distributed means of cohorts were tested using independent sample t-tests, otherwise tested using non-parametric Mann-Whitney U test. A p-value of ≤ 0.05 was considered statistically significant.
Ethical approval was obtained from the institution’s Medical Research Ethics Committee. All research was carried out according to the principles of the Declaration of Helsinki. This study was conducted retrospectively to assess routine clinical care and standard practices of this clinical setting.
Results
A total of 103 infants were included: 55 in cohort 1 and 48 in cohort 2. The mean gestational age for both cohorts was 28.0 weeks. There were no significant differences between the two cohorts in their baseline characteristics, including mean gestation age, birth growth parameters (Wt, Lt, HC), day of life at the start of fortification, and the time of reaching full enteral feeds or energy intake (maximum kcal/oz ingested) [Table 1].
Table 1: Baseline characteristics.
|
Gestational age, weeks*
|
28.6 (2.2)
|
28.7 (2.7)
|
23–35
|
0.852
|
|
BW, g*
|
1124.8 (215.7)
|
1208.2 (393.7)
|
500–2000
|
0.195
|
|
Birth Lt, cm*
|
36.6 (3.5)
|
36.7 (4.3)
|
23–46
|
0.885
|
|
Birth HC, cm*
|
25.4 (2.0)
|
25.3 (3.0)
|
19.5–32.0
|
0.752
|
|
DOL at start of feeds**
|
3.0 (2.0, 5.0)
|
2.0 (2.0, 3.8)
|
1–23
|
0.018***
|
|
DOL at start of fortification**
|
15 (10, 24)
|
14.0 (8.0, 19.0)
|
2–161
|
0.421
|
|
DOL at full feeds**
|
20.0 (11.0, 3.0)
|
15.5 (7.3, 3.0)
|
4–181
|
0.112
|
|
Weight at start of fortification (W0) (g)*
|
1211.7 (233.8)
|
1275.8 (392.7)
|
600–2320
|
0.317
|
|
Energy intake (maximum Kcal/oz)#
|
|
|
-
|
0.505
|
|
24
|
17 (30.9)
|
11 (23.4)
|
|
|
|
26/27
|
37 (67.3)
|
36 (76.6)
|
|
|
BW: birth weight; Lt: length; HC: head circumference; DOL: day of life. *Variable expressed as mean (SD); **Variable expressed as median (IQR); # Value expressed as n (%); ***p-value ≤ 0.05 considered statistically significant.
There was no difference in mean weight before the start of fortification (W0). The growth rates are presented in [Table 2]. The mean weight gain velocity was significantly higher in cohort 2 during the first and second weeks after commencing fortification. Subsequently, although weight gain velocity was higher in cohort 2, the difference in weight gain velocity during P3 was not statistically significant. Linear and HC growth during the three periods were statistically comparable. Although there were no significant differences in the mean values of discharge growth parameters [Table 3], significantly fewer infants of cohort 2 had discharge weight < 10th centile (p = 0.029). Additionally, significantly more infants from cohort 2 had discharge weight in the 10th–50th centile or > 50th centile [Figure 1]. Both cohorts were discharged at a mean PCA of approximately 36.0 weeks. LOS was not statistically different [Table 3].
Table 2: Growth rates after starting fortification.
|
Weight gain velocity, mean (SD), g/kg/day
|
|
P1
|
7.6 (9.7)
|
12.5 (7.9)
|
0.009
|
|
P2
|
13.4 (5.9)
|
16.9 (9.3)
|
0.050
|
|
P3
|
13.4 (5.9)
|
16.9 (9.3)
|
0.174
|
|
Length gain, cm/week
|
|
P1 (W1 – W0)
|
1.0 (0.0, 2.5)
|
2.0 (0.0, 3.5)
|
0.254
|
|
P2 (W2 – W1)
|
1.0 (0.0, 2.0)
|
1.0 (0.0, 2.0)
|
0.120
|
|
P3 (W3 – W2)
|
1.0 (0.0, 2.0)
|
1.0 (0.0, 2.0)
|
0.639
|
|
HC gain, median (IQR), cm/week
|
|
P1 (W1 – W0)
|
1.5 (0.0, 2.6)
|
2.0 (0.5, 3.0)
|
0.272
|
|
P2 (W2 – W1)
|
1.0 (0.5, 1.0)
|
1.0 (0.5, 1.5)
|
0.232
|
P1: period 1; P2: period 2; P3: period 3; W0: at the start of fortification;
W1: week 1; W2: week 2; W3: week 3.
*p-value ≤ 0.05 considered statistically significant.
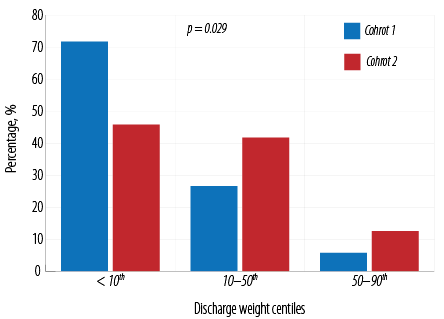 Figure 1: Discharge weight centiles for the
study cohorts.
Table 3: Differences in the outcomes of discharge parameters.
|
Discharge Wt, g*
|
2008.9 (519.0)
|
2069.5 (396.9)
|
0.515
|
|
Discharge Lt, cm*
|
42.5 (3.6)
|
43.4 (3.3)
|
0.265
|
|
Discharge HC, cm*
|
30.7 (2.0)
|
30.3 (1.8)
|
0.325
|
|
PCA at discharge, weeks*
|
36.5 (3.8)
|
36.0 (2.9)
|
0.467
|
Wt: weight; Lt: length; HC: head circumference; PCA: post-conceptional age; LOS: length of stay. *Variable expressed as mean (SD); **Variable expressed as median (IQR).
Both cohorts have an overall up-trending serum Na level over the four follow-up points. The median Na level was significantly higher in cohort 2 at one and two weeks post-fortification [Table 4], although the difference may not be clinically relevant since both cohorts had mean serum Na levels within normal ranges at those time points. There were no clinically significant differences in Ca, PO4, albumin, and ALP levels. The urea level was significantly higher (but within the normal upper reference limit) in cohort 2 during the second and third weeks post-fortification and at the time of discharge.
Table 4: Weekly levels of serum sodium, calcium, phosphate, ALP, albumin, and urea.
|
Na
|
136.7
(3.6)
|
138.6
(3.0)
|
0.004*
|
137.3
(3.0)
|
139.2
(3.3)
|
0.005*
|
137.4
(3.4)
|
141.9
(17.8)
|
0.090
|
139.5
(2.6)
|
140.4
(2.0)
|
0.070
|
|
Ca
|
2.60
(0.1)
|
2.58
(0.1)
|
0.280
|
2.62
(0.1)
|
2.61
(0.1)
|
0.820
|
2.6
(0.1)
|
2.5
(0.1)
|
0.030*
|
2.63
(0.1)
|
2.58
(0.1)
|
0.040*
|
|
PO4
|
1.9
(0.3)
|
2.1
(0.3)
|
0.050
|
2.0
(0.2)
|
2.1
(0.3)
|
0.680
|
1.9
(0.3)
|
1.9
(0.4)
|
0.960
|
2.0
(0.2)
|
2.1
(0.3)
|
0.130
|
|
ALP
|
376.8
(126.8)
|
362.4
(156.3)
|
0.610
|
360.1
(120.9)
|
327.7
(132.7)
|
0.270
|
360.1
(112.3)
|
359.7
(119.0)
|
0.990
|
350.5
(103.3)
|
349.2
(97.9)
|
0.950
|
|
Alb
|
34.3
(3.8)
|
35.6
(4.6)
|
0.180
|
33.9
(3.9)
|
34.6 (4.1)
|
0.400
|
33.1
(4.5)
|
34.8
4.0)
|
0.080
|
34.7
(4.0)
|
36.7
(3.3)
|
0.010*
|
Na: sodium; Ca: calcium; PO4: phosphate; ALP: alkaline phosphatase; Alb: albumin. *p-value ≤ 0.05 considered statistically significant.
There was a statistically significant higher use of other adjunctive forms of fortifications in cohort 1, with almost 70.9% receiving other adjunctive fortifications in cohort 1 compared to only 12.5% of cohort 2 (p = 0.035) [Table 5]. Significantly more cases of NEC were observed in cohort 1 (11 cases, 20.0%) compared to two cases (4.2%) in cohort 2 (p = 0.018). A review of NEC cases in cohort 1 revealed the following: stage 1 = 7 cases; stage II = 2 cases; stage III = 2 cases. The two cases of NEC in cohort 2 were stage II. The rates of feeding intolerance and other complications of prematurity (i.e., intraventricular hemorrhage, BPD, patent ductus arteriosus, ROP, and culture-positive sepsis) were statistically comparable. Univariate analysis of factors related to weight gain velocity revealed that a significant determinant was fortification cohort (p = 0.003), with cohort 1 having a mean weight gain velocity of 11.1 g/kg/day and cohort 2 of 12.1 g/kg/day [Table 6]. Birth weight, gestational age, and adjunctive fortification methods were not significant contributors toward weight gain velocity.
Table 5: Comparison of categorical variables of secondary outcomes and preterm complications.
|
IVH
|
3 (5.5)
|
9 (18.8)
|
0.062
|
|
PDA
|
11 (20.0)
|
10 (20.8)
|
1.000
|
|
BPD
|
24 (43.6)
|
16 (33.3)
|
0.316
|
|
NEC
|
11 (20.0)
|
2 (4.2)
|
0.018**
|
|
ROP
|
12 (21.8)
|
14 (29.2)
|
0.496
|
|
Culture-positive sepsis
|
7 (12.7)
|
5 (10.4)
|
1.000
|
|
≥ 1 episode of feeding intolerance
|
14 (25.5)
|
14 (29.2)
|
0.661
|
IVH: intraventricular hemorrhage; PDA: patent ductus arteriosus;
BPD: bronchopulmonary dysplasia; NEC: necrotising enterocolitis;
ROP: retinopathy of prematurity. *Tested using the chi-square test; *
* p value ≤ 0.05 considered statistically significant.
Table 6: Univariate analysis of factors that may be related to weight gain velocity.
|
Cohort
|
|
1
|
11.1 (8.5)
|
0.003**
|
|
2
|
12.1 (14.2)
|
|
Gestational age
|
-0.035
|
0.560
|
|
Birth weight
|
-0.059
|
0.325
|
|
Adjunctive fortification
|
|
Yes
|
11.9 (8.9)
|
**Value p ≤0.05 considered statistically significant.
By multivariate regression analysis, the occurrence of NEC was found to be significantly associated with cohort 1, or fortification with PF (odds ratio (OR) = 8.27, CI: 1.46–46.86; p = 0.017), while gestational age (OR = 0.87, CI: 0.63–1.22; p = 0.430) and birth weight (OR = 0.99, CI: 0.99–1.00; p = 0.098) were found to not be significant.
Discussion
To the best of our knowledge, this is the first study of its kind in the Arabian Gulf population or in other similar emerging global economies, with a few exceptions.18,27 While the benefits of human milk fortification over exclusive breastfeeding are relatively established, the number of comparative studies between HMF and commercial PF as two approaches towards preterm nutrition are limited, despite the common use of PF in resource-poor settings and the potential benefits of HMF.28,29 Our retrospective cohort study compared these two methods of human milk fortification each used in different periods in the same healthcare setting. Oman has a rate of 2.84 births per woman. Such a high birth rate reflects that Oman is currently in the second phase of demographic transition, and thus, is “home to one of the youngest populations in the world”.30,31 This may contribute to an increasing risk of preterm birth. In addition to this, with the increase in women’s empowerment due to widespread education and shifting gender roles, the country is witnessing increased pregnancy among relatively older women aged 35–49 years compared to the past.20 Therefore, finding evidence-based mechanisms to safeguard the well-being of such a vulnerable strata of the population is warranted.
The practice of using formula powder to fortify EBM has been explored, especially as an alternative to HMF in resource-restricted settings.29 In a prospective randomized controlled trial, 148 infants < 1500 g and < 35 weeks gestation were randomized into a control group that received EBM and a fortification group that received fortified human milk using a commercially available infant milk powder.32 Weight gain and linear growth were significantly higher in the formula-fortified breast milk group, while biochemical parameters, sepsis rates, feed intolerance, and NEC were not significantly different between the two groups.32 A randomized study of 123 VLBW, < 34 weeks’ gestation preterm infants receiving either HMF-fortified EBM or PF-fortified EBM reported no significant difference in mean weight gain between the two groups, and the study concluded that fortification with PF powder is not inferior to HMF fortification.18 A systematic review and meta-analysis analyzing a total of five studies in which infants were fed breast milk fortified with PF, suggested that commercially available PF powders can be considered a safe and efficacious alternative to HMF in developing economies.28 However, a limitation of this study is that only five studies met the inclusion criteria, likely limiting the generalization of the results.
The findings of comparable linear and HC growth between the two cohorts of this current study correlate well with Chinnappan et al.18 However, in our study, the increase in the means of weight gain velocity in the initial two weeks following the start of fortification significantly favors HMF over PF. Although mean weight gain velocity remained higher in cohort 2 in the subsequent week as well (i.e., P3), significance was not found. This loss of significance might have been explained by the notably higher proportion of patients in cohort 1 (70.9% vs. 12.5%) receiving other adjunctive forms of fortification, although analysis revealed that adjunctive fortification was not a significant factor of weight gain velocity. However, at the time of discharge, significantly fewer infants of cohort 2 had discharge weight < 10th centile and more often had a discharge weight in the 10–50th centile or > 50th centile compared to cohort 1. Consistently, higher mean urea levels after fortification in cohort 2 are likely to be an indicator of better protein intake with HMF fortification.33
There was a significantly higher rate of NEC in cohort 1, who were fed with PF-fortified EBM. Of note, there were no other significant changes in the unit’s feeding practices and the two cohorts were similar in terms of mean gestational age and BW. Interestingly, this finding does not correlate with those of the aforementioned two studies that used formula powder to fortify breast milk, where the NEC rates were similar to breast milk alone or HMF-fortified human milk.18,32 However, an increased risk of NEC has been demonstrated with the use of PF for feeding preterm infants compared to either feeding with the mother’s breast milk or donor breast milk.10,17,34
Increased scientific interest in the comparability between PF and HMF could help further analysis of their respective pharmacokinetic and nutrient bioavailability properties in different demographic groups. Absorption, utilization, and bioavailability of important nutrients, such as Ca, can be affected by factors such as race, ethnicity, and genotype.35,36 Nutritional needs may also be dependent on these variables, such as the strong influence of maternal race and environmental factors on the vitamin D stores at birth. This results in greater potential for vitamin D deficiency in Indian, Middle-Eastern, and African-American preterm infants.37
These possible demographic variations could explain the significantly positive response to fortification with HMF rather than PF in our study, compared to the results of Chinnappan et al,18 and Warner et al,38 where the weight gain velocities of the PF and HMF groups were comparable. Adjustable targeted HMF fortification protocols are capable of overcoming these possible demographic discrepancies by optimizing feeding regimens and components according to each neonate’s growth velocity and laboratory values.39
This study has a few limitations worth mentioning. First, the retrospective design of this study is not ideal to determine the specific causality. Although all exclusively formula-fed infants were excluded, some infants in either cohort received some formula feeding as an alternative when EBM was not available. It is difficult to determine the impact of this limitation on the results of this study. Furthermore, while the analysis accounted for possible confounders that might have had an impact on the results of the two historical cohorts, it would not be accurate to say that the only difference in the NICU management protocols between the two different periods was the change of fortification from PF to HMF. Future studies with prospective, longitudinal, randomized control study protocols would be best to derive conclusive results.
Second, due to the wide range of gestational ages, the duration of exposure to fortification was variable, with some infants being discharged before completing three weeks of feeds with the fortifier. A larger sample would allow for the stratification of newborns based on age or length of hospital stay, followed by further analysis and comparison of their respective results.
Third, it is equally important to mention the NICU practice of changing calorie concentrations to 24 kcal/oz once the baby is on-demand feeds, which typically happens a few days before hospital discharge. This could have impacted discharge growth parameters, limiting the generalization of this study and its results.
Fourth, it was beyond the scope of the present study to perform a cost analysis of the use of HMF and PF. While strategies on appropriate neonatal feeding practices from other resource-poor countries are present in the literature,29 the unique situation in Oman, a developing nation with a high-income economy, could be better captured by future research that builds on the results of the present study to further assess the relative cost-effectiveness of the use of PF and HMF in Omani NICUs.
Finally, due to logistical reasons in this retrospective study, the exclusion criteria included neonates that died prior to discharge or had palliative care status. This may have resulted in potential attrition bias. Additionally, as the setting of this study is a major tertiary health setting in Oman, it is a common referral center for high-risk pregnancies, which may have naturally led to an increased number of multifactorial preterm and neonatal complications, which introduces confounding bias.
Conclusion
The use of HMF for human milk fortification compared to PF powder was associated with better weight gain, decreased need for other forms of fortification, and a lower rate of NEC. The discharge weight in infants receiving HMF-fortified EMB was more likely to be > 10th centile for age. Studies with more robust methodologies, such as randomized control trials, are required to form conclusive results on the potential benefits of fortification with HMF over PF powder.
Disclosure
The authors declared no conflicts of interest. No funding was received for this study.
references
- 1. Liu L, Oza S, Hogan D, Chu Y, Perin J, Zhu J, et al. Global, regional, and national causes of under-5 mortality in 2000-15: an updated systematic analysis with implications for the sustainable development goals. Lancet 2016 Dec;388(10063):3027-3035.
- 2. Ong KK, Kennedy K, Castañeda-Gutiérrez E, Forsyth S, Godfrey KM, Koletzko B, et al. Postnatal growth in preterm infants and later health outcomes: a systematic review. Acta Paediatr 2015 Oct;104(10):974-986.
- 3. Belfort MB, Ehrenkranz RA. Neurodevelopmental outcomes and nutritional strategies in very low birth weight infants. Seminars in Fetal and Neonatal Medicine 2017;22(1):42-48.
- 4. Ramel SE, Gray HL, Christiansen E, Boys C, Georgieff MK, Demerath EW. Greater early gains in fat-free mass, but not fat mass, are associated with improved neurodevelopment at 1 year corrected age for prematurity in very low birth weight preterm infants. J Pediatr 2016 Jun;173:108-115.
- 5. Chan SH, Johnson MJ, Leaf AA, Vollmer B. Nutrition and neurodevelopmental outcomes in preterm infants: a systematic review. Acta Paediatr 2016 Jun;105(6):587-599.
- 6. Victora CG, Bahl R, Barros AJ, França GV, Horton S, Krasevec J, et al; Lancet Breastfeeding Series Group. Breastfeeding in the 21st century: epidemiology, mechanisms, and lifelong effect. Lancet 2016 Jan;387(10017):475-490.
- 7. Rozé J-C, Darmaun D, Boquien C-Y, Flamant C, Picaud J-C, Savagner C, et al. The apparent breastfeeding paradox in very preterm infants: relationship between breast feeding, early weight gain and neurodevelopment based on results from two cohorts, EPIPAGE and LIFT. BMJ Open 2012 Apr;2(2):e000834.
- 8. Dicky O, Ehlinger V, Montjaux N, Gremmo-Féger G, Sizun J, Rozé JC, et al; EPIPAGE 2 Nutrition Study Group; EPINUTRI Study Group. Policy of feeding very preterm infants with their mother’s own fresh expressed milk was associated with a reduced risk of bronchopulmonary dysplasia. Acta Paediatr 2017 May;106(5):755-762.
- 9. Bharwani SK, Green BF, Pezzullo JC, Bharwani SS, Bharwani SS, Dhanireddy R. Systematic review and meta-analysis of human milk intake and retinopathy of prematurity: a significant update. J Perinatol 2016 Nov;36(11):913-920.
- 10. McGuire W, Anthony MY. Donor human milk versus formula for preventing necrotising enterocolitis in preterm infants: systematic review. Arch Dis Child Fetal Neonatal Ed 2003 Jan;88(1):F11-F14.
- 11. Sullivan S, Schanler RJ, Kim JH, Patel AL, Trawöger R, Kiechl-Kohlendorfer U, et al. An exclusively human milk-based diet is associated with a lower rate of necrotizing enterocolitis than a diet of human milk and bovine milk-based products. Journal of Pediatrics 2010;156(4):562-567.
- 12. Ballard O, Morrow AL. Human milk composition: nutrients and bioactive factors. Pediatr Clin North Am 2013 Feb;60(1):49-74.
- 13. Martins EC, Krebs VL. Effects of the use of fortified raw maternal milk on very low birth weight infants. J Pediatr (Rio J) 2009 Mar-Apr;85(2):157-162.
- 14. Agostoni C, Buonocore G, Carnielli VP, De Curtis M, Darmaun D, Decsi T, et al; ESPGHAN Committee on Nutrition. Enteral nutrient supply for preterm infants: commentary from the European society of paediatric gastroenterology, hepatology and nutrition committee on nutrition. J Pediatr Gastroenterol Nutr 2010 Jan;50(1):85-91.
- 15. Arslanoglu S, Moro GE, Ziegler EE; The Wapm Working Group On Nutrition. Optimization of human milk fortification for preterm infants: new concepts and recommendations. J Perinat Med 2010 May;38(3):233-238.
- 16. Mukhopadhyay K, Narnag A, Mahajan R. Effect of human milk fortification in appropriate for gestation and small for gestation preterm babies: a randomized controlled trial. Indian Pediatr 2007 Apr;44(4):286-290.
- 17. Quigley M, Embleton ND, McGuire W. Formula versus donor breast milk for feeding preterm or low birth weight infants. Cochrane Database Syst Rev 2019 Jul;7(7):CD002971.
- 18. Chinnappan A, Sharma A, Agarwal R, Thukral A, Deorari A, Sankar MJ. Fortification of breast milk with preterm formula powder vs human milk fortifier in preterm neonates: a randomized noninferiority trial. JAMA Pediatr 2021 Aug;175(8):790-796.
- 19. Arslanoglu S. IV. Individualized fortification of human milk: adjustable fortification. J Pediatr Gastroenterol Nutr 2015;61(Suppl 1):S4-S5.
- 20. Islam MM. Increasing incidence of infants with low birth weight in Oman. Sultan Qaboos Univ Med J 2015 May;15(2):e177-e183.
- 21. Abdellatif M, Ahmed M, Bataclan MF, Khan AA, Al Battashi A, Al Maniri A. The patterns and causes of neonatal mortality at a tertiary hospital in Oman. Oman Med J 2013 Nov;28(6):422-426.
- 22. Al Dhawi AA, West DJ Jr, Spinelli RJ, Gompf TA. The challenge of sustaining health care in Oman. Health Care Manag (Frederick) 2007 Jan-Mar;26(1):19-30.
- 23. Al Riyami N, Al Salmiyah M, Khan D, Al Riyami I. Maternal and neonatal outcomes of operative vaginal deliveries at a single tertiary center. Oman Med J 2021 May;36(3):e263.
- 24. Neu J. Necrotizing enterocolitis: the search for a unifying pathogenic theory leading to prevention. Pediatr Clin North Am 1996 Apr;43(2):409-432.
- 25. Jobe AH, Bancalari E. Bronchopulmonary dysplasia. Am J Respir Crit Care Med 2001 Jun;163(7):1723-1729.
- 26. International Committee for the Classification of Retinopathy of Prematurity. The international classification of retinopathy of prematurity revisited. Archives of ophthalmology (Chicago, Ill: 1960) 2005;123(7):991-999.
- 27. Khorana M, Jiamsajjamongkhon C. Pilot study on growth parameters and nutritional biochemical markers in very low birth weight preterm infants fed human milk fortified with either human milk fortifier or post discharge formula. Journal of the Medical Association of Thailand= Chotmaihet Thangphaet 2014;97:S164-S175.
- 28. Kumar M, Upadhyay J, Basu S. Fortification of human milk with infant formula for very low birth weight preterm infants: a systematic review. Indian Pediatr 2021 Mar;58(3):253-258.
- 29. Murguia-Peniche T, Kirsten GF. Meeting the challenge of providing neonatal nutritional care to very or extremely low birth weight infants in low-resource settings. Nutritional Care of Preterm Infants 2014;110:278-296.
- 30. Islam MM. Demographic transition in Sultanate of Oman: emerging demographic dividend and challenges. Middle East Fertil Soc J 2020;25(1):7.
- 31. Al-Adawi S, Al-Sibani N, Al-Harthi L, Shetty M, Joe Valentina J, Al Sadoon M. The frequency and correlates of mental health problems among khaliji students in post-secondary education. Post-secondary education student mental health: a global perspective. 2021 [cited 2022 January]. Available from: https://cdspress.ca/wp-content/uploads/2022/08/ch-1-Samir-Al-Adawi-et-al-1.pdf.
- 32. Gupta V, Rebekah G, Sudhakar Y, Santhanam S, Kumar M, Thomas N. A randomized controlled trial comparing the effect of fortification of human milk with an infant formula powder versus unfortified human milk on the growth of preterm very low birth weight infants. J Matern Fetal Neonatal Med 2020 Aug;33(15):2507-2515.
- 33. Mathes M, Maas C, Bleeker C, Vek J, Bernhard W, Peter A, et al. Effect of increased enteral protein intake on plasma and urinary urea concentrations in preterm infants born at < 32 weeks gestation and < 1500 g birth weight enrolled in a randomized controlled trial - a secondary analysis. BMC Pediatr 2018 May;18(1):154.
- 34. Ginovart G, Gich I, Gutiérrez A, Verd S. A fortified donor milk policy is associated with improved in-hospital head growth and weight gain in very low-birth-weight infants. Adv Neonatal Care 2017 Aug;17(4):250-257.
- 35. Gibson RS. The role of diet- and host-related factors in nutrient bioavailability and thus in nutrient-based dietary requirement estimates. Food Nutr Bull 2007 Mar;28(1)(Suppl International):S77-S100.
- 36. Weaver CM. Calcium requirements: the need to understand racial differences. The American Journal of Clinical Nutrition 1998 Dec 1;68(6):1153-1154.
- 37. Mimouni FB, Mandel D, Lubetzky R. Formulation of preterm formula: what’s in it, and why? Neonatal Pharmacology and Nutrition Update; 2015. p. 83-107.
- 38. Warner JT, Linton HR, Dunstan FD, Cartlidge PH. Growth and metabolic responses in preterm infants fed fortified human milk or a preterm formula. Int J Clin Pract 1998 Jun;52(4):236-240.
- 39. Ottolini KM, Schulz EV, Limperopoulos C, Andescavage N. Using nature to nurture: breast milk analysis and fortification to improve growth and neurodevelopmental outcomes in preterm infants. Nutrients 2021 Nov;13(12):4307.