No-show patients, who neither keep nor cancel scheduled appointments, are a persistent burden on healthcare systems, impacting revenues, costs, and efficient resource utilization.1–3 No-show rates are reported to vary across healthcare levels (primary, secondary, and tertiary), clinical settings, and countries.4–6 An international systematic review estimated that no-show rates in primary healthcare could be as high as 50%.6 No-shows generate negative impacts at the providers, patients, and societal levels. For providers, they result in lost time, increased healthcare costs, decreased productivity/efficiency, and limit the facility’s effective capacity.7–10 For patients, no-shows reduce satisfaction and quality of care.1,11 No-shows affect both the health of those who missed the appointment by not receiving the needed medical care on time and of other waiting patients.1,3,11 Due to the unused staff time, the ineffective use of equipment, and the possible loss of other patients’ time, no-shows generate social costs as well.12
The following patient characteristics are frequently associated with no-show behavior: young adult,6,13–16 prior history of missed appointments,6,14 lower socioeconomic status,6,15 underinsured,6,15 belonging to a racial minority group,14–16 unmarried,17 place of residence distant from the clinic,6,18 unemployed,17 transportation issues,15 changed/improved health,14,15 and an inability to leave school or work.14,15,18 Other reported determinants of no-show were: the time gap between scheduling and the actual appointment,6,18 time of the day, day of the week, and month of the year,16,18,19 the characteristics of the clinic or the practice,18,19 and the patient-provider communication.15
No-shows have been most intensively studied in primary healthcare (PHC) settings as they form the nucleus of public healthcare systems.20–22 An efficiently run primary care system increases patient satisfaction, lowers overall healthcare expenses, and even reduces the number of drug prescriptions.23 The core function of primary care is providing continuous care and failure to attend a primary care appointment disrupts the flow.15 It is important to understand the quantitative and qualitative determinants of no-shows before we can tackle them.
In Oman, PHC is provided through local hospitals (LHs) and PHC centers. LHs have a small number of beds that provide primary healthcare services and basic inpatient care to people in a catchment area. These health centers are classified in three categories: Health Centre (HC) the basic category, Health Centre with Beds (HCB), and Extended Health Centre (EHC).24 EHCs provide access to some specialty care clinics as an alternative to referral to hospitals. The HCs and EHCs do not provide inpatient care.24 EHC specialty clinics are the focus of our study. Patient access to them is by referral from a general practitioner (GP) in any type of HC. Prior to 2014, appointments were not required for specialist services in EHCs. The appointments system was gradually phased between 2014 and 2017. Unlike in some countries, there is no penalty in Oman for missing medical appointments.
Despite their burden on the healthcare system, the extent and nature of no-shows at Omani PHCs have not yet been studied. Therefore, this study examines the phenomenon in detail, beginning with 2014, when the appointments system was first introduced in the country. It also examines the patient characteristics that potentially predict no-show behaviors. Our findings might inform the design of the appointment system to better deliver timely and convenient access to health services for all patients by smoothing the workflow, reducing crowding, and allowing the system to honor patient and provider preferences while matching supply and demand.25
Methods
This study characterized no-shows in three types of EHC-based specialty clinics—ophthalmology (OPT), ear, nose, and throat (ENT), and dermatology. There are 25 EHCs in Oman; 17 have either dermatology or ENT clinics, or both, and 18 have OPT clinics. The type of data we sought was available only for 14 EHCs. Forty specialty clinics from these 14 EHCs, comprising 14 ENT, 13 OPT, and 13 dermatology specialties, were constituted our sample.
We selected these three specialties to capture differences in no-show behavior across practices that deal with patients with quite different needs, and to study specialties that are not very different from each other in terms of consultation time per patient.
Data on all appointments made to OPT, ENT, and dermatology clinics located at the EHCs were obtained from the Directorate General of Information Technology at the Ministry of Health. The data covered the period between January 2014 and April 2020. As some EHCs introduced an appointment system later than January 2014, we included the data pertaining to each EHC only from the date the appointment system was introduced in that particular EHC.
We retrieved the data on appointments, both new and follow-up. A new appointment process is initiated when a GP refers a patient to a specialist. This is followed by two successive waiting periods: first, the period from the date of the GP’s request till the date of the specialist’s approval, and second, from the date of approval till the date of appointment. Follow-up appointments are usually generated by the specialist (who usually has access to the scheduling system) during the first and subsequent patient visits. Therefore, the only waiting time for follow-up appointments is the period between the date of approval and the appointment date.
While our descriptive analyses included the two successive waiting times associated with new appointments, our regressions mainly utilized the waiting time between the approval and appointment because the request dates were sometimes not available. We excluded the data pertaining to same-day appointments (which constituted 0.34% of all appointments) and those with extremely long waiting periods of ≥ 365 days (0.28%) to prevent these outliers from skewing results.
Most EHC clinics were seeing patients between 7:00 AM and 2:00 PM (some clinics worked between 7:30 AM and 2:30 PM). To investigate possible association between the time of the appointment and no-show trends, we divided the clinic hours into three slots of time: 7:00 AM to 9:29 AM, 9:30 AM to 11:59 AM, and 12:00 noon to 2:30 PM. In addition, we examined for any evidence of seasonality in no-show trends across months, especially in the Islamic month of fasting, Ramadan. Ramadan follows the Hijri calendar and its dates do not fall within the same month of the Gregorian calendar each year. Therefore, we created a variable system to identify the appointments that fell within the month of Ramadan.
The last variable we evaluated was the experience of the EHCs with the appointment system. However, the EHCs we studied had introduced appointments system on different dates, and we tested whether the no-show rates changed over time within each EHC. The experience variable (in 100’s days) was calculated by taking the difference between each appointment date and the first appointment booked in each EHC.
We analyzed the data using Stata software (StataCorp. 2013. Stata Statistical Software: Release 13. College Station, TX: StataCorp LP.). The descriptive analysis provides background information regarding (i) the number of completed visits in each specialty and percentages of completed visits that were appointments (since walk-ins were also permitted); (ii) the total number of booked visits and the percentages of no-show among these visits; and (iii) the average waiting time for each new appointment/follow-up, specialty-wise. Most descriptive statistics are presented across the six years studied (2014–2020).
No-show is a binary variable (no-show vs. show). The no-show rate is the number of no-shows divided by the number of booked appointments. The next step of the analysis involved estimating a logistic regression to determine the association between no-shows and patient characteristics (age and sex), appointment characteristics (appointment type, time, month, and clinic), and institutional characteristics (EHC’s experience and fixed effects). We did not include year indicator variables in the regression since they were collinear with the experience variable. While many of the regressors reflected patient characteristics, the data did not distinguish between genuine no-shows and cancelations initiated by the EHC. We, therefore, ran the regressions with and without the EHC fixed effects to determine how the coefficients of patient variables were affected in each case. As extensions to the main analysis, we replicated some of the regression models separately for males and females, and for new and follow-up appointments. In all the regression models, the standard errors were clustered at the EHC level.
Results
Table 1 shows the total number of completed visits and the percentages of kept appointments at three types of specialty clinics that operated from 14 EHCs. Panel A shows all completed visits with or without an appointment system in operation before 2017 when only some clinics had appointment system in place. Panel B includes only the EHCs with an appointment system in operation, which is all EHCs in 2017 and later. Ignoring the year 2014, given the small and selected nature of the clinics that gave appointments, the percentage of appointment-based visits to all three specialties increased monotonically till 2020 (a stub year). The usage accelerated post-2017 by when the appointment system was operational throughout the network. Nevertheless, even by 2020, only less than half of all visits were appointment-based. We noticed that the appointments in OPT, and ENT were declined over the years while those for dermatology oscillated without any recognizable time trend.
Table 1: Number of completed visits and percentage appointments in the extended health centers
from 2014 to 2020.
|
2014
|
187 003
|
129 740
|
173 347
|
490 090
|
|
5.6
|
6.3
|
7.9
|
6.6
|
|
2015
|
190 212
|
124 567
|
178 283
|
493 062
|
|
7.8
|
7.0
|
10.9
|
8.7
|
|
2016
|
177 421
|
114 673
|
182 683
|
474 777
|
|
14.9
|
16.2
|
25.2
|
19.2
|
|
Total
|
1 048 388
|
725 424
|
1 122 070
|
2 895 882
|
|
17.3
|
19.0
|
28.4
|
22.0
|
|
2014
|
32 117
|
24 827
|
45 999
|
102 943
|
|
32.7
|
32.7
|
29.9
|
31.5
|
|
2015
|
86 251
|
52 405
|
78 923
|
217 579
|
|
16.9
|
16.4
|
24.2
|
20.1
|
|
2016
|
136 571
|
89 289
|
142 000
|
367 860
|
|
18.3
|
19.5
|
30.3
|
24.6
|
|
2017
|
160 570
|
112 044
|
177 024
|
449 638
|
|
19.1
|
22.6
|
34.0
|
27.6
|
|
2018
|
151 496
|
110 906
|
181 096
|
443 498
|
|
26.5
|
27.1
|
40.5
|
33.8
|
|
2019
|
144 648
|
106 224
|
182 548
|
433 420
|
|
31.8
|
33.9
|
46.1
|
39.5
|
|
2020*
|
37 038
|
27 270
|
47 089
|
111 397
|
|
33.9
|
39.3
|
46.1
|
41.1
|
*Data for 2020 are until April. OPT: ophthalmology clinic; DERM: dermatology clinic; ENT: ear, nose, and throat clinic.
Table 2 shows the total number of booked appointments and the percentage of no-shows by clinic and year. To understand the relationship between Tables 1 and 2, note that for OPT clinics in 2014, Table 1 shows that just over 32.7% of completed visits were by appointment. The comparable cell in Table 2 shows just under 64.5% of the 29 564 OPT appointments were no-shows. With minor exceptions, the overall no-show rate declined over time, although it remained close to 50.0% in 2019 and 2020.
Table 2: Numbers of booked appointments and percentages of no-show by year and clinic.
|
2014
|
29 564
|
22 991
|
41 257
|
93 812
|
64.5
|
64.8
|
66.6
|
65.5
|
|
2015
|
47 142
|
25 512
|
52 775
|
125 429
|
67.8
|
65.4
|
62.7
|
65.1
|
|
2016
|
71 327
|
47 226
|
108 069
|
226 622
|
63.0
|
60.6
|
57.3
|
59.8
|
|
2017
|
76 876
|
58 027
|
131 788
|
266 691
|
60.2
|
56.4
|
54.3
|
56.4
|
|
2018
|
92 715
|
65 652
|
147 467
|
305 834
|
56.7
|
54.2
|
50.2
|
53.0
|
|
2019
|
95 089
|
70 682
|
159 068
|
324 839
|
51.6
|
49.1
|
47.1
|
48.9
|
|
2020*
|
28 396
|
20 999
|
45 779
|
95 174
|
55.8
|
49.0
|
52.6
|
52.7
|
Data for 2020 is until April only. OPT: ophthalmology clinic; DERM: dermatology clinic; ENT: ear, nose, and throat clinic.
Table 3 illustrates the wait time (in days) for new appointments and follow-ups. The total wait-time for the new appointments is separated into total time from the request and the total time from the request to the approval of the appointment. Wait times may be affected by the appointment system, but more importantly by the factors beyond the appointments system and especially the total number of available visits, which is seen to be declining in Table 1.
Table 3: Average waiting time for appointment by year, clinic, and appointment type (days).
|
2014
|
80
|
90
|
65
|
48
|
8
|
7
|
39
|
42
|
31
|
|
2015
|
75
|
74
|
56
|
41
|
12
|
9
|
36
|
28
|
21
|
|
2016
|
79
|
92
|
39
|
44
|
58
|
7
|
40
|
69
|
12
|
|
2017
|
80
|
67
|
45
|
39
|
18
|
8
|
45
|
37
|
26
|
|
2018
|
93
|
76
|
52
|
44
|
15
|
10
|
50
|
37
|
29
|
|
2019
|
98
|
78
|
56
|
53
|
27
|
18
|
53
|
43
|
31
|
|
2020
|
86
|
89
|
62
|
51
|
25
|
16
|
56
|
38
|
30
|
*New: new appointments. 1Request: number of days from the date of request for appointment to the date of approval. 2Approval: number of days from the approval date to the appointment date. Follow-up appointments are generated and approved automatically by the requesting physicians; therefore there is no waiting between the request and the approval. Data for 2020 is until April only. OPT: ophthalmology clinic; DERM: dermatology clinic; ENT: ear, nose, and throat clinic.
Table 4 lists the following data for each EHC: the numbers of completed visits, the percentages of appointments to overall visits, waiting periods (split into new and follow-up appointments), and no-shows (also split similarly, in addition to specialty-wise). This data reveals enormous differences between the centers' performance. For example, the EHCs with the largest numbers of completed visits (Jaalan n = 338 101 and Sur n = 288 098) had the smallest percentages of their visits by appointments (0.1% and 4.6%, respectively). There were also substantial variations in wait times and no-show rates across centers and specialty types. We used regression analysis to characterize patterns in no-show rates.
Table 4: Total number of completed visits in each Extended Health Centre (EHC) after introduction of the appointment system, percentages of completed appointment-based visits, average waiting time for appointments (days), and the percentages of no-shows.
|
Barka
|
66 012
|
33.6
|
66
|
43
|
57
|
|
53.9
|
93.0
|
71.9
|
|
50.2
|
88.1
|
64.3
|
|
43.3
|
73.5
|
53.2
|
|
Bawshar
|
181 880
|
55.8
|
88
|
50
|
71
|
|
29.1
|
62.5
|
47.4
|
|
25.2
|
63.2
|
42.1
|
|
29.1
|
66.7
|
42.8
|
|
Al Buraymi
|
93 216
|
22.8
|
67
|
38
|
56
|
|
41.6
|
43.7
|
42.3
|
|
66.4
|
95.7
|
67.4
|
|
NA
|
NA
|
NA
|
|
Ibri
|
97 812
|
42.9
|
39
|
21
|
32
|
|
66.4
|
38.0
|
60.0
|
|
NA
|
NA
|
NA
|
|
40.0
|
43.9
|
41.6
|
|
Jaalan
|
338 101
|
0.1
|
54
|
12
|
54
|
|
66.7
|
0.0
|
66.0
|
|
83.3
|
0.0
|
78.1
|
|
66.8
|
|
66.8
|
|
Al Khaburah
|
73 642
|
19.0
|
38
|
16
|
32
|
|
46.1
|
77.5
|
55.5
|
|
58.9
|
80.3
|
63.5
|
|
57.4
|
83.7
|
62.8
|
|
Al Musanaah
|
65 973
|
52.9
|
45
|
24
|
35
|
|
43.5
|
47.6
|
46.4
|
|
46.5
|
46.8
|
46.6
|
|
45.1
|
49.6
|
46.7
|
|
Nizwa
|
109 441
|
52.5
|
51
|
19
|
39
|
|
39.8
|
49.4
|
43.6
|
|
42.7
|
44.4
|
43.3
|
|
46.3
|
48.7
|
47.1
|
|
A'Rustaq
|
175 040
|
22.0
|
56
|
17
|
49
|
|
57.8
|
73.5
|
60.5
|
|
54.6
|
61.1
|
55.8
|
|
50.0
|
59.3
|
51.5
|
|
A'Seeb
|
226 509
|
40.2
|
82
|
50
|
66
|
|
36.1
|
88.4
|
68.2
|
|
38.0
|
86.3
|
64.3
|
|
46.1
|
91.9
|
64.4
|
|
Shinas
|
65 617
|
38.5
|
44
|
22
|
36
|
|
62.8
|
72.4
|
67.6
|
|
58.2
|
68.4
|
62.9
|
|
57.3
|
58.1
|
57.5
|
|
Sohar
|
273 086
|
55.5
|
42
|
14
|
33
|
|
55.4
|
70.9
|
62.9
|
|
50.1
|
61.6
|
54.9
|
|
54.3
|
61.8
|
56.0
|
|
Sur
|
288 098
|
4.6
|
25
|
10
|
24
|
|
74.5
|
96.3
|
78.9
|
|
55.9
|
60.0
|
56.2
|
|
66.1
|
42.0
|
65.0
|
|
A'Suwayq
|
71 919
|
25.1
|
37
|
22
|
31
|
|
47.8
|
63.6
|
55.5
|
|
54.7
|
71.9
|
63.4
|
|
50.5
|
70.4
|
55.8
|
The numbers of completed visits include only the visits after introducing the appointment system. Waiting time (for both new and follow-up appointments) equals the number of days from the date of approval and the date of the appointment. Jaalan EHC had only five new appointments booked between 2014 and 2020, and all were attended. OPT: ophthalmology clinic; DERM: dermatology clinic; ENT: ear, nose, and throat clinic; NA: the center does not have the relevant specialty/clinic.
Table 5: Summary of three logistic regression models of the probability of no-shows.
|
Female
|
0.891‡
|
0.891‡
|
0.898‡
|
|
(0.020)
|
(0.020)
|
(0.011)
|
|
Age (male)
|
0.996†
|
0.996†
|
0.996†
|
|
(0.001)
|
(0.001)
|
(0.001)
|
|
Age (female)
|
0.998
|
0.998
|
0.998*
|
|
(0.001)
|
(0.001)
|
(0.001)
|
|
Clinic (DERM)
|
|
|
|
|
OPT
|
1.017
|
1.016
|
1.025
|
|
(0.122)
|
(0.122)
|
(0.104)
|
|
ENT
|
1.031
|
1.032
|
1.019
|
|
(0.108)
|
(0.109)
|
(0.071)
|
|
Appointment Type (follow-up)
|
|
New
|
2.691†
|
2.693†
|
3.070‡
|
|
(0.861)
|
(0.864)
|
(0.866)
|
|
Appointment time (7:00 – 9:30 am)
|
|
9:30 am –12:00 pm
|
0.858‡
|
0.856‡
|
0.916
|
|
(0.036)
|
(0.036)
|
(0.062)
|
|
12:00 pm – 2:30 pm
|
0.654‡
|
0.655‡
|
0.772*
|
|
(0.047)
|
(0.047)
|
(0.102)
|
|
Appointment month (Jan)
|
|
Feb
|
0.896‡
|
0.896‡
|
0.888‡
|
|
(0.025)
|
(0.025)
|
(0.026)
|
|
Mar
|
0.986
|
0.986
|
0.979
|
|
(0.035)
|
(0.035)
|
(0.036)
|
|
Apr
|
1.090‡
|
1.086‡
|
1.063*
|
|
(0.025)
|
(0.025)
|
(0.028)
|
|
May
|
1.206‡
|
1.082†
|
1.019
|
|
(0.033)
|
(0.032)
|
(0.041)
|
|
Jun
|
1.271‡
|
1.099*
|
1.029
|
|
(0.059)
|
(0.042)
|
(0.021)
|
|
Jul
|
1.089
|
1.057
|
1.060
|
|
(0.062)
|
(0.060)
|
(0.039)
|
|
Aug
|
1.116*
|
1.115*
|
1.082*
|
|
(0.057)
|
(0.057)
|
(0.034)
|
|
Sep
|
0.990
|
0.989
|
0.985
|
|
(0.042)
|
(0.042)
|
(0.031)
|
|
Oct
|
0.940
|
0.940
|
0.946
|
|
(0.044)
|
(0.044)
|
(0.037)
|
|
Nov
|
1.075*
|
1.075*
|
1.085*
|
|
(0.036)
|
(0.036)
|
(0.035)
|
|
Dec
|
1.011
|
1.011
|
1.007
|
|
(0.027)
|
(0.027)
|
(0.017)
|
|
Experience
(100 days)
|
0.988
|
0.988
|
0.976*
|
|
(0.013)
|
(0.013)
|
(0.010)
|
|
Ramadan
|
|
1.406‡
|
1.483‡
|
|
|
(0.050)
|
(0.070)
|
|
Institution Name (Barka)
|
|
Bawshar
|
|
|
0.463‡
|
|
|
|
(0.028)
|
|
Al Buraymi
|
|
|
0.598‡
|
|
|
|
(0.047)
|
|
Ibri
|
|
|
0.604‡
|
|
|
|
(0.042)
|
|
Al Khaburah
|
|
|
1.446‡
|
|
|
|
(0.064)
|
|
Al Musanaah
|
|
|
0.532‡
|
|
|
|
(0.035)
|
|
Nizwa
|
|
|
0.665‡
|
|
|
|
(0.027)
|
|
A'Rustaq
|
|
|
1.339‡
|
|
|
|
(0.079)
|
|
A'Seeb
|
|
|
1.335‡
|
|
|
|
(0.100)
|
|
Shinas
|
|
|
1.126‡
|
|
|
|
(0.027)
|
|
Sohar
|
|
|
1.202‡
|
|
|
|
(0.058)
|
|
A'Suwayq
|
|
|
1.145
|
|
|
|
(0.104)
|
|
Waiting time
|
Included
|
Included
|
Included
see Fig 1
|
|
Total number of booked appoinments
(2014-2020)
|
1 304 793
|
1 304 793
|
1 304 793
|
The numbers represent the exponentiated coefficients (i.e., odds ratio) and robust standard errors in parentheses. All standard errors are clustered on EHCs. The variables in parentheses in the first column are the base category. The EHCs with < 5.0% of their visits as appointments (i.e., Jaalan and Sur EHCs) are excluded from these models. We reran the same models with all EHCs included, and the results did not change significantly (see Appendix 1). The three regression models also include a fifth-order polynomial in waiting time, which we display in figure 1 based on model 3. EHC: Extended Health Center; OPT: ophthalmology clinic. DERM: dermatology clinic; ENT: ear, nose, and throat clinics; *p < 0.050; †: p < 0.010; ‡: p < 0.001; r2: R-squared.
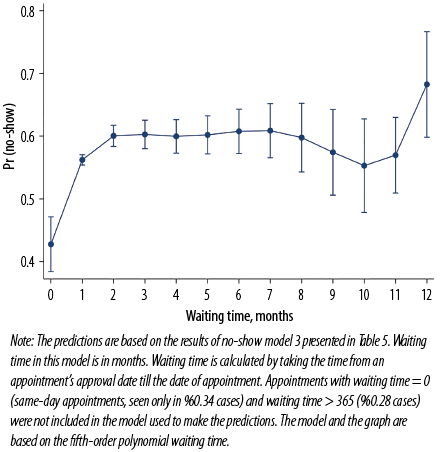 Figure 1: Adjusted predictions of the probabilities of no-shows with 95% CIs at different waiting times (0–12 months) estimated at the means of covariates.
Table 5 presents logistic regression results where Y = 1 if the appointment was a no-show and Y = 0 otherwise. The reported coefficients are odds ratios (exponentiated coefficients for the change in the probability of not attending an appointment). This table presents three models: compared to model 1, model 2 adds the month of Ramadan to show the change in seasonality with and without Ramadan, and model 3 includes EHC fixed-effects to demonstrate the change in the other variables in predicting no-shows when controlled for EHC-level fixed on unobservables. The analysis presented in Table 5 and Figure 1 excludes EHCs that had < 5% of their visits as appointments (i.e., Jaalan and Sur EHCs). However, we reran the same models keeping all 14 EHCs, and there was no significant change in the results [Appendix 1].
Our results suggest that male patients were 11.0% more likely to skip an appointment than female patients. There is an interaction between patients’ sex and age for predicting no-shows, and the results suggest that the likelihood of no-show diminished with age, especially for men. Using model 3, we tested for the difference in age interacting with sex for predicting no-shows, and we found they were significantly different from each other (p < 0.001). Our results did not find evidence supporting the contention that specialties might have significantly different no-show rates conditional on the other variables in the regression.
Not shown in this table, we also found that new appointments were associated with significantly shorter waiting periods (p < 0.001) than follow-ups. Nevertheless, our results suggest that the probability of no-shows was about two and a half to three times higher among new appointments compared to follow-up appointments. We found this difference to be significant even after controlling for EHCs. Further, models 1 and 2 suggest that the probability of no-show was higher when the scheduled appointment was earlier in the day. However, this effect diminished upon adding the institutional fixed effects (model 3).
Our results also found seasonality in the probability of no-shows. Appointments in the months of April, May and June had particularly high no-show rates as per Model 1. Model 2 introduces the ‘Ramadan effect,’ indicating somewhat higher no-show rates for appointments in Ramadan, and most significantly in the years when the holy month occurred during May, and June. After holding EHCs constant, the effect of seasonality persisted with February having a lower rate of no-show, followed by April, August, and November, while Ramadan having higher rates of no-show. We jointly tested the month coefficients, which were highly significant (p < 0.001), providing further evidence that they differed in their no-show rates. In addition, regression suggested that the probability of no-show decreased by 2.4% for every 100 days of experience that an EHC had with the appointment system. With respect to experience, there were nonlinear terms that were statistically significant if other variables were not included in the regression, but highly collinear with the other variables (especially waiting time), while the nonlinear terms were not statistically significant when waiting time was added.
Based on model 3, the results suggest that the probability of no-shows was different across health clinics and the magnitude of the effects as revealed in the table were substantial. For instance, the no-show rate in Bawshar EHC was 54.0% lower than in Barka center. We jointly tested for the centers’ coefficients being equal to each other, and the null hypothesis was rejected with the test statistic being highly significant (p < 0.001).
The three regression models also include waiting time in months as one of the covariates. We found that waiting time is best modeled as a fifth-order polynomial, which is hard to interpret by looking at the regression coefficients; therefore, we present the marginal effect of waiting time in predicting no-shows in Figure 1 (based on model 3). We ran the model with a third-order polynomial for waiting time, and the graph took a sideways S-shape as a result of underspecifying the polynomial. Nevertheless, once we allow it to be a higher-order polynomial, the curve looks flatter and less S-shaped. The graph also indicates that waiting time most reliably predicted no-shows between the first and fifth or sixth months of waiting; beyond seven months it is seen to become less reliable as the confidence intervals become very wide. The plot suggests the probability of a no-show increasing dramatically with time in the first two months; but thereafter, additional waiting time has no appreciable impact.
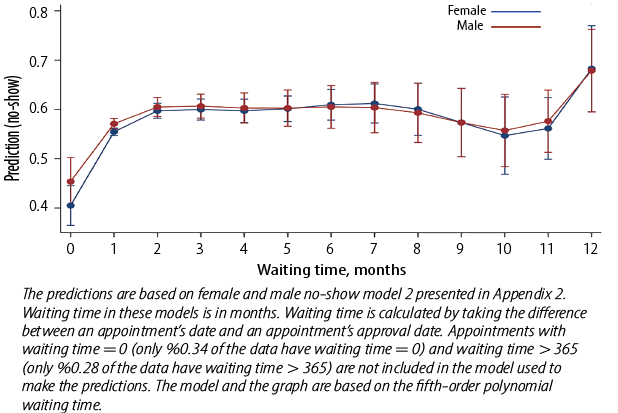
We reran models 2 and 3 from Table 5 separately for females and males [Appendix 2 and 3]. Overall, the models suggest the same associations between our dependent and independent variables, and the female and male models being very similar to each other. For instance, both older females and males were less likely to miss an appointment. In models not listed in the attached table, we found that age was best specified as being linear for males but as second-order polynomial for females. Similar to the general model, the female and male models offered no evidence of association between no-show rates and specialty. However, these models continue to suggest the same association between no-show rates and the appointment type and time. Both males and females gave lower no-show rates in February, and higher no-show rates in August and during Ramadan.
Finally, the female and male models support the finding that no-shows were likely to increase with waiting time [Appendix 4]. The graph shows that the male no-show rate is slightly higher than the female no-show rate, as observed in Table 5, but in general, they remain close to each other.
A second sensitivity analysis is presented in Appendixes 5 and 6 where we have separate models for new and follow-up appointments, one excluding EHCs that has < 5.0% of their visits as appointments and another with all the EHCs included. These models support our findings that males had a higher probability of no-show and that no-show rates decreased with aging. In addition, the new and follow-up appointment models support there being no differencing no-show rates across specialties. However, these models show more attenuated appointment time effects. Both types of appointments indicate significantly higher no-show rates during Ramadan. Having the new and follow-up appointments in separate models indicates that the negative association between no-show rates and experience is significant only with new appointments. Similar to the original model, the different EHCs have significantly different no-show rates. The margins plots for the association between the probability of no-show and waiting time for the new and follow-up appointments (see Appendix 7) suggest that in relation to the waiting time, the probability of no-show for the new appointments is significantly higher than the follow-up appointments. The model predicts no-show rates for both appointments very precisely as indicated by the narrow CIs. However, the very large confidence intervals for new appointments beyond seven months indicate that the prediction may be unreliable beyond that period.
Discussion
Using administrative data from OPT, ENT, and dermatology clinics in 14 EHCs in Oman, our findings suggest an average no-show rate of 55.6%, higher than the global PHC average of 23.0%.6 No-show rates in our study tended to be higher in those EHCs which had lower percentages of their visits as appointments. We also found the overall no-show rates decreasing over time. Previously in Omani EHCs, visits without appointments used to be the norm. As the appointment system was gradually phased in, booking and keeping appointments became the new norm leading to a progressive decrease in the no-show rates. To the best of our knowledge, this is the first study that has characterized the phenomenon of no-shows in PHC setting in Oman. Further, we could not find any previous studies that assessed the association between no-shows and Ramadan in PHCs. However, a study conducted at a university hospital in Saudi Arabia reported a lack of significant association between no-show rate and Ramadan.26 The no-show rate in Ramadan in our study might be attributed to the change in eating and sleeping hours as many people stay awake most of the night, making them more likely to miss a daytime appointment.
Our finding on the impact of the appointment lead time on no-show rate is consistent with the international studies.16,18,19,27,28 Elkhider et al,29 found that with each day increase in lead time, odds ratio (OR) of no-show increased by a factor of 1.0019 (p < 0.001). We found the probability of no-show increasing dramatically with a lead time for the first two months, but after that additional waiting time had no appreciable impact. Elkhider et al,29 found that odds of no-show were higher in younger patients (p ≤ 0.001; OR = 0.49) compared to those aged ≥ 60. We also found a similar trend.
Regarding the impact of patient’s sex, our study and several others16,18,19,27,28 found no-show rates to be higher among men. However, there is no international consistency on this. Elkhider et al,29 reported that the odds of no-show were higher in women (p < 0.001; OR = 1.1352). This discrepancy might be related to differences in the population structure and health system arrangement, including the availability of health insurance. In addition, in the Omani context, a study conducted at the Royal Hospital (tertiary care/specialized care) reported that age, sex, patient’s residence distance from the hospital, waiting time and day, and season were important predictors for no-show.30
No-show issues in non-traditional modes of consultations are also being investigated. Virtual consultations have risen in popularity during COVID-19 pandemic. A recent study in the USA found that the no-show rates for phone consultations in psychiatry were significantly lower than face-to-face mode for both new visits (p = 0.021) and return visits (p < 0.001).31 However, for new appointments for televisits, no-show rates did not significantly differ from face-to-face mode (p = 0.681) or return (p = 0.186).31 Interestingly, a study on dermatology clinics found that televisits had significantly lower no-show rates compared with clinic visits.32 This suggests that different types of health disciplines may require different strategies to tackle no-show rates.
A recent strategy to reduce no-shows involves allowing online access to patients who then manage their own appointments. Such web-based appointment systems have reported a helpful way to reduce no-shows.33 UK’s national online electronic referral and booking service Choose and Book is reported to facilitate significantly higher attendance rates than traditional methods.34 With reports of success of the patient-driven appointment system, its suitability for Omani PHCs may be worth investigating.
The main strength of our study is its large sample size pertaining to different institutions and specialties at the national level over several years with no missing data. The study’s main limitation might be that it has not included some important demographic data relevant to the characteristics of no-shows (e.g., patients’ health, marital, and socioeconomic status). In addition, we confined our study to three specialties and its results might not be comparable to certain others, for example, mental health services.
Our findings have important implications for policymakers and researchers. First, they can be utilized in planning and implementing an appointment system. More specifically, our findings suggest that identifying the appropriate number of appointment slots per day can be fine-tuned by adjusting for differing probabilities of no-show for males and females, younger and older patients, the different EHCs, and specific months such as Ramadan. Oman can introduce an electronic appointment system by adding the option of self-scheduling/rescheduling in the existing Shifa application. Before moving forward, the Omani MOH can benefit from the Saudi MOH experience with their Mawid application. Our findings can also help other countries with large Muslim populations who observe Ramadan in planning their appointment systems. An important next step for the research is expanding the study to understand no-shows by adding more demographic variables, including all the specialties in PHC settings, and studying no-show for the same specialties at the secondary and tertiary settings to determine the stability of our model in predicting no-shows.
The most important implication for research is to conduct qualitative studies to identify the no-show determinants among the Omani population, including the behavioral determinants. In addition, similar studies should be conducted at the national level, across specialties and care levels, to find the constant determinants across all and the ones that might change. More models should also be created to identify the most appropriate interventions to enhance the existing appointment system with more patient access.
Conclusion
It is important to maximize the efficiency of our health resources. No-shows hinder patients’ ability to access the health system and reduce quality of care. Despite the importance and expansion of the PHC in Oman, no-shows have not been studied yet. We aimed to characterize no-shows in the Omani PHC setting, particularly in respect of OPT, ENT, and dermatology clinics. We found high no-show rates which were associated with patient age and sex, appointment hour, appointment month (especially Ramadan), patient experience with the appointment system, and factors specific to individual EHC. Policymakers should consider these factors and evolve mechanisms that enable individual PHCs to anticipate the varying quantum of no-shows and use that data to optimize the number of daily appointments.
Disclosure
The authors declared no conflicts of interest. No funding was received for this study.
references
- 1. Gupta D, Wang WY. Patient appointments in ambulatory care. Handbook of healthcare system scheduling. Springer; 2012. p. 65-104.
- 2. Alaeddini A, Yang K, Reddy C, Yu S. A probabilistic model for predicting the probability of no-show in hospital appointments. Health Care Manag Sci 2011 Jun;14(2):146-157.
- 3. Goldman L, Freidin R, Cook EF, Eigner J, Grich P. A multivariate approach to the prediction of no-show behavior in a primary care center. Arch Intern Med 1982 Mar;142(3):563-567.
- 4. Cayirli T, Veral E, Rosen H. Designing appointment scheduling systems for ambulatory care services. Health Care Manag Sci 2006 Feb;9(1):47-58.
- 5. Davies ML, Goffman RM, May JH, Monte RJ, Rodriguez KL, Tjader YC, et al. Large-scale no-show patterns and distributions for clinic operational research. Healthcare (Basel) 2016 Feb;4(1):E15.
- 6. Dantas LF, Fleck JL, Cyrino Oliveira FL, Hamacher S. No-shows in appointment scheduling - a systematic literature review. Health Policy 2018 Apr;122(4):412-421.
- 7. LaGanga LR, Lawrence SR. Clinic overbooking to improve patient access and increase provider productivity. Decis Sci 2007;38(2):251-276.
- 8. Peng Y, Erdem E, Shi J, Masek C, Woodbridge P. Large-scale assessment of missed opportunity risks in a complex hospital setting. Inform Health Soc Care 2016;41(2):112-127.
- 9. Atun RA, Sittampalam SR, Mohan A. Uses and benefits of SMS in healthcare delivery. Imperial College London, Centre for Health Management; 2005.
- 10. Downer SR, Meara JG, Da Costa AC. Use of SMS text messaging to improve outpatient attendance. Med J Aust 2005 Oct;183(7):366-368.
- 11. Husain-Gambles M, Neal RD, Dempsey O, Lawlor DA, Hodgson J. Missed appointments in primary care: questionnaire and focus group study of health professionals. Br J Gen Pract 2004 Feb;54(499):108-113.
- 12. Bech M. The economics of non-attendance and the expected effect of charging a fine on non-attendees. Health Policy 2005 Oct;74(2):181-191.
- 13. Jung HP, Baerveldt C, Olesen F, Grol R, Wensing M. Patient characteristics as predictors of primary health care preferences: a systematic literature analysis. Health expectations. 2003 Jun;6(2):160-81.
- 14. Samuels RC, Ward VL, Melvin P, Macht-Greenberg M, Wenren LM, Yi J, et al. Missed appointments: factors contributing to high no-show rates in an urban pediatrics primary care clinic. Clin Pediatr (Phila) 2015 Sep;54(10):976-982.
- 15. Kaplan-Lewis E, Percac-Lima S. No-show to primary care appointments: why patients do not come. J Prim Care Community Health 2013 Oct;4(4):251-255.
- 16. Lee SR, Dix DB, McGwin G, Odom CK, Netto CC, Naranje SM, et al. Correlation of appointment times and subspecialty with the no-show rates in an orthopedic ambulatory clinic. J Healthc Manag 2018 Nov-Dec;63(6):e159-e169.
- 17. Odonkor CA, Christiansen S, Chen Y, Sathiyakumar A, Chaudhry H, Cinquegrana D, et al. Factors associated with missed appointments at an academic pain treatment center: a prospective year-long longitudinal study. Anesth Analg 2017 Aug;125(2):562-570.
- 18. Samorani M, LaGanga LR. Outpatient appointment scheduling given individual day-dependent no-show predictions. Eur J Oper Res 2015;240(1):245-257.
- 19. Kheirkhah P, Feng Q, Travis LM, Tavakoli-Tabasi S, Sharafkhaneh A. Prevalence, predictors and economic consequences of no-shows. BMC Health Serv Res 2016 Jan;16(1):13.
- 20. World Health Organization. Primary health care. 2019 [cited 2019 December 1]. Available from: https://www.who.int/news-room/fact-sheets/detail/primary-health-care.
- 21. McComb S, Tian Z, Sands L, Turkcan A, Zhang L, Frazier S, et al. Cancelled primary care appointments: a prospective cohort study of diabetic patients. J Med Syst 2017 Apr;41(4):53.
- 22. Mehrotra A, Keehl-Markowitz L, Ayanian JZ. Implementing open-access scheduling of visits in primary care practices: a cautionary tale. Ann Intern Med 2008 Jun;148(12):915-922.
- 23. Starfield B. Primary care and health. A cross-national comparison. JAMA 1991 Oct;266(16):2268-2271.
- 24. Undersecretariat for planning affairs. Ministry of Health. Sultanate of Oman. Health vision 2050: synopsis of strategic studies; 2015 [Cited December 2021]. Available from: https://www.moh.gov.om/documents/16506/119833/Health+Vision+2050/7b6f40f3-8f93-4397-9fde-34e04026b829.
- 25. Gupta D, Denton B. Appointment scheduling in health care: challenges and opportunities. IIE Trans 2008;40(9):800-819.
- 26. Nour El-Din MM, Al-Shakhs FN, Al-Oudah SS. Missed appointments at a university hospital in eastern Saudi Arabia: magnitude and association factors. J Egypt Public Health Assoc 2008;83(5-6):415-433.
- 27. Hadaib I, Anglade P, Ibrahim H. Factors contributing to non-attendance of GI endoscopic procedures in a tertiary care center in the Middle East. Asian Pac J Cancer Prev 2022 Jan;23(1):33-37.
- 28. Bhavsar NA, Doerfler SM, Giczewska A, Alhanti B, Lutz A, Thigpen CA, et al. Prevalence and predictors of no-shows to physical therapy for musculoskeletal conditions. PLoS One 2021 May;16(5):e0251336.
- 29. Elkhider H, Sharma R, Sheng S, Thostenson J, Kapoor N, Veerapaneni P, et al. Predictors of no-show in neurology clinics. Healthcare 2022;10(4):599.
- 30. Alawadhi A, Palin V, van Staa T. Prevalence and factors associated with missed hospital appointments: a retrospective review of multiple clinics at Royal Hospital, Sultanate of Oman. BMJ Open 2021 Aug;11(8):e046596.
- 31. Muppavarapu K, Saeed SA, Jones K, Hurd O, Haley V. Study of impact of telehealth use on clinic “no show” rates at an academic practice. Psychiatr Q 2022 Jun;93(2):689-699.
- 32. Franciosi EB, Tan AJ, Kassamali B, O’Connor DM, Rashighi M, LaChance AH. Understanding the impact of teledermatology on no-show rates and health care accessibility: a retrospective chart review. J Am Acad Dermatol 2021 Mar;84(3):769-771.
- 33. Zhao P, Yoo I, Lavoie J, Lavoie BJ, Simoes E. Web-based medical appointment systems: a systematic review. J Med Internet Res 2017 Apr;19(4):e134.
- 34. Parmar V, Large A, Madden C, Das V. The online outpatient booking system ‘Choose and Book’ improves attendance rates at an audiology clinic: a comparative audit. Inform Prim Care 2009;17(3):183-186.
Appendix 1: Summary of three logistic regression models of the probability of no-show including all EHCs.
|
Female
|
0.890‡
|
0.890‡
|
0.898‡
|
|
(0.019)
|
(0.019)
|
(0.011)
|
|
Age (male)
|
0.996†
|
0.996†
|
0.996†
|
|
(0.001)
|
(0.001)
|
(0.001)
|
|
Age (female)
|
0.998
|
0.998
|
0.998*
|
|
(0.001)
|
(0.001)
|
(0.001)
|
|
Clinic (DERM)
|
|
|
|
|
OPT
|
1.035
|
1.034
|
1.024
|
|
(0.124)
|
(0.124)
|
(0.103)
|
|
ENT
|
1.054
|
1.054
|
1.019
|
|
(0.114)
|
(0.115)
|
(0.071)
|
|
Appointment type (follow-up)
|
|
New
|
2.767†
|
2.769†
|
3.071‡
|
|
(0.880)
|
(0.883)
|
(0.863)
|
|
Appointment time (7:00 – 9:30 am)
|
|
9:30 am – 12:00 pm
|
0.865†
|
0.863†
|
0.916
|
|
(0.040)
|
(0.039)
|
(0.062)
|
|
12:00 pm – 2:30 pm
|
0.663‡
|
0.664‡
|
0.772*
|
|
(0.051)
|
(0.051)
|
(0.101)
|
|
Appointment month (Jan)
|
|
Feb
|
0.896‡
|
0.896‡
|
0.889‡
|
|
(0.025)
|
(0.025)
|
(0.026)
|
|
Mar
|
0.987
|
0.987
|
0.980
|
|
(0.034)
|
(0.034)
|
(0.036)
|
|
Apr
|
1.091‡
|
1.086‡
|
1.063*
|
|
(0.025)
|
(0.024)
|
(0.028)
|
|
May
|
1.206‡
|
1.081†
|
1.019
|
|
(0.032)
|
(0.033)
|
(0.040)
|
|
Jun
|
1.270‡
|
1.098*
|
1.030
|
|
(0.058)
|
(0.042)
|
(0.021)
|
|
Jul
|
1.085
|
1.053
|
1.060
|
|
(0.061)
|
(0.059)
|
(0.038)
|
|
Aug
|
1.116*
|
1.116*
|
1.083*
|
|
(0.056)
|
(0.056)
|
(0.034)
|
|
Sep
|
0.987
|
0.987
|
0.986
|
|
(0.041)
|
(0.041)
|
(0.031)
|
|
Oct
|
0.938
|
0.938
|
0.947
|
|
(0.043)
|
(0.043)
|
(0.037)
|
|
Nov
|
1.075*
|
1.075*
|
1.085†
|
|
(0.035)
|
(0.035)
|
(0.034)
|
|
Dec
|
1.009
|
1.009
|
1.007
|
|
(0.026)
|
(0.026)
|
(0.017)
|
|
Experience (100 days)
|
0.988
|
0.987
|
0.976*
|
|
(0.013)
|
(0.013)
|
(0.010)
|
|
Ramadan
|
|
1.406‡
|
1.483‡
|
|
|
(0.050)
|
(0.070)
|
|
Institution name (Barka)
|
|
Bawshar
|
|
|
0.463‡
|
|
|
|
(0.027)
|
|
Al Buraymi
|
|
|
0.598‡
|
|
|
|
(0.047)
|
|
Ibri
|
|
|
0.603‡
|
|
|
|
(0.042)
|
|
Jaalan
|
|
|
2.083‡
|
|
|
|
(0.195)
|
|
Al Khaburah
|
|
|
1.446‡
|
|
|
|
(0.064)
|
|
Al Musanaah
|
|
|
0.532‡
|
|
|
|
(0.035)
|
|
Nizwa
|
|
|
0.665‡
|
|
|
|
(0.027)
|
|
A'Rustaq
|
|
|
1.339‡
|
|
|
|
(0.079)
|
|
A'Seeb
|
|
|
1.335‡
|
|
|
|
(0.100)
|
|
Shinas
|
|
|
1.126‡
|
|
|
|
(0.027)
|
|
Sohar
|
|
|
1.202‡
|
|
|
|
(0.058)
|
|
Sur
|
|
|
NA
|
|
A'Suwayq
|
|
|
1.145
|
|
|
|
(0.103)
|
|
N
|
1 318 589
|
1 318 589
|
1 305 562
|
The numbers represent the exponentiated coefficients (odds ratios). Robust standard errors are in parentheses. All standard errors are clustered on EHCs. The variables in parentheses in the first column are the base category. The EHCs with < 5.0% of their visits as appointments (i.e., Jaalan and Sur EHCs) are included in these models. NA: coefficient cannot be estimated (not available), due to the very small number of observations and perfect collinearity with waiting time and other variables. The three regression models also include fifth-order polynomial in waiting time, which we display in figure 1 based on model 3. EHCs: extended health centers; OPT: ophthalmology clinic; DERM: dermatology clinic; ENT: ear, nose, and throat clinic. * p < 0.050; † p < 0.010; ‡ p < 0.001.
Appendix 2: Summary of two logistic regression models of the probability of no-shows for females and males separately excluding the EHCs that have < 5.0% of their visits as appointments.
|
Age (years)
|
0.998*
|
0.998*
|
0.997†
|
0.997†
|
|
(0.001)
|
(0.001)
|
(0.001)
|
(0.001)
|
|
Clinic (DERM)
|
|
OPT
|
1.083
|
1.077
|
0.939
|
0.962
|
|
(0.131)
|
(0.104)
|
(0.116)
|
(0.108)
|
|
ENT
|
1.117
|
1.096
|
0.943
|
0.936
|
|
(0.116)
|
(0.068)
|
(0.104)
|
(0.080)
|
|
Appointment type (follow-up)
|
|
New
|
2.657†
|
3.058‡
|
2.744†
|
3.090‡
|
|
(0.874)
|
(0.880)
|
(0.853)
|
(0.852)
|
|
Appointment time (7:00 – 9:30 am)
|
|
9:30 am – 12:00 pm
|
0.858‡
|
0.929
|
0.856‡
|
0.900
|
|
(0.038)
|
(0.065)
|
(0.033)
|
(0.060)
|
|
12:00 pm – 2:30 pm
|
0.648‡
|
0.777
|
0.667‡
|
0.766*
|
|
(0.051)
|
(0.103)
|
(0.043)
|
(0.101)
|
|
Appointment month (Jan)
|
|
Feb
|
0.900‡
|
0.892‡
|
0.891‡
|
0.884‡
|
|
(0.026)
|
(0.028)
|
(0.027)
|
(0.027)
|
|
Mar
|
1.002
|
0.996
|
0.966
|
0.958
|
|
(0.033)
|
(0.034)
|
(0.039)
|
(0.041)
|
|
Apr
|
1.108‡
|
1.088†
|
1.056†
|
1.031
|
|
(0.031)
|
(0.034)
|
(0.022)
|
(0.025)
|
|
May
|
1.077*
|
1.013
|
1.086*
|
1.026
|
|
(0.035)
|
(0.044)
|
(0.036)
|
(0.043)
|
|
Jun
|
1.104†
|
1.032
|
1.092*
|
1.026
|
|
(0.039)
|
(0.022)
|
(0.049)
|
(0.027)
|
|
Jul
|
1.035
|
1.039
|
1.089
|
1.089*
|
|
(0.059)
|
(0.040)
|
(0.063)
|
(0.038)
|
|
Aug
|
1.095
|
1.056*
|
1.144*
|
1.117†
|
|
(0.053)
|
(0.028)
|
(0.063)
|
(0.043)
|
|
Sep
|
0.990
|
0.988
|
0.988
|
0.982
|
|
(0.040)
|
(0.030)
|
(0.046)
|
(0.035)
|
|
Oct
|
0.940
|
0.947
|
0.940
|
0.944
|
|
(0.039)
|
(0.031)
|
(0.053)
|
(0.046)
|
|
Nov
|
1.080†
|
1.091†
|
1.069
|
1.077
|
|
(0.030)
|
(0.029)
|
(0.043)
|
(0.042)
|
|
Dec
|
1.015
|
1.010
|
1.006
|
1.004
|
|
(0.023)
|
(0.020)
|
(0.036)
|
(0.022)
|
|
Ramadan
|
1.485‡
|
1.567‡
|
1.318‡
|
1.389‡
|
|
(0.060)
|
(0.078)
|
(0.049)
|
(0.071)
|
|
Experience (100 days)
|
0.989
|
0.976*
|
0.986
|
0.976*
|
|
(0.013)
|
(0.010)
|
(0.013)
|
(0.010)
|
|
Institution name (Barka)
|
|
Bawshar
|
|
0.460‡
|
|
0.465‡
|
|
|
(0.026)
|
|
(0.030)
|
|
Al Buraymi
|
|
0.601‡
|
|
0.593‡
|
|
|
(0.046)
|
|
(0.049)
|
|
Ibri
|
|
0.604‡
|
|
0.609‡
|
|
|
(0.040)
|
|
(0.045)
|
|
Al Khaburah
|
|
1.597‡
|
|
1.282‡
|
|
|
(0.072)
|
|
(0.055)
|
|
Al Musanaah
|
|
0.530‡
|
|
0.533‡
|
|
|
(0.034)
|
|
(0.037)
|
|
Nizwa
|
|
0.669‡
|
|
0.655‡
|
|
|
(0.029)
|
|
(0.024)
|
|
A'Rustaq
|
|
1.461‡
|
|
1.212‡
|
|
|
(0.094)
|
|
(0.063)
|
|
A'Seeb
|
|
1.317‡
|
|
1.356‡
|
|
|
(0.097)
|
|
(0.105)
|
|
Shinas
|
|
1.090‡
|
|
1.179‡
|
|
|
(0.027)
|
|
(0.027)
|
|
Sohar
|
|
1.243‡
|
|
1.148†
|
|
|
(0.063)
|
|
(0.052)
|
|
A'Suwayq
|
|
1.233*
|
|
1.027
|
|
|
(0.111)
|
|
(0.094)
|
|
N
|
731 278
|
731 278
|
573 515
|
573 515
|
The numbers represent the exponentiated coefficients (i.e., odds ration) and robust standard errors in parentheses. All standard errors are clustered on EHCs. The variables in parentheses in the first column are the base category. The EHC with < 5.0% of their visits as appointments (i.e., Jaalan and Sur EHCs) are excluded from these models. We reran the same models with all EHCs included, and the results did not change significantly. The regression models also include fifth-order polynomial in waiting time, which we display in Appendix 4 based on model 2 for each gender. EHCs: extended health centers; OPT: ophthalmology clinic; DERM: dermatology clinic; ENT: ear, nose, and throat clinic. * p < 0.050; †p < 0.010; ‡p < 0.001.
Appendix 3: Summary of two logistic regression models of the probability of no-shows for females and males separately including all EHCs.
|
Female
|
0.878‡
|
0.894‡
|
0.907‡
|
0.902‡
|
|
(0.027)
|
(0.023)
|
(0.019)
|
(0.019)
|
|
Age (male)
|
0.996†
|
0.996‡
|
0.996†
|
0.996‡
|
|
(0.002)
|
(0.001)
|
(0.001)
|
(0.001)
|
|
Age (female)
|
0.997*
|
0.997*
|
0.998
|
0.998*
|
|
(0.001)
|
(0.001)
|
(0.001)
|
(0.001)
|
|
Clinic (DERM)
|
|
OPT
|
1.086
|
1.074
|
0.962
|
0.918
|
|
(0.200)
|
(0.149)
|
(0.104)
|
(0.096)
|
|
ENT
|
1.501*
|
1.187
|
0.898
|
0.933
|
|
(0.262)
|
(0.120)
|
(0.096)
|
(0.074)
|
|
Appointment time (8:00 – 9:30 am)
|
|
9:30 am – 12:00 pm
|
0.815
|
0.880
|
0.905*
|
0.966
|
|
(0.102)
|
(0.100)
|
(0.040)
|
(0.049)
|
|
12:00 pm – 3:00 pm
|
0.476†
|
0.808
|
0.785‡
|
0.972
|
|
(0.126)
|
(0.119)
|
(0.053)
|
(0.048)
|
|
Appointment month (Jan)
|
|
Feb
|
0.927*
|
0.920*
|
0.880‡
|
0.876‡
|
|
(0.029)
|
(0.037)
|
(0.027)
|
(0.024)
|
|
Mar
|
1.051
|
1.049
|
0.954
|
0.948
|
|
(0.034)
|
(0.042)
|
(0.037)
|
(0.037)
|
|
Apr
|
1.158‡
|
1.099*
|
1.048
|
1.027
|
|
(0.038)
|
(0.044)
|
(0.039)
|
(0.043)
|
|
May
|
1.159‡
|
1.013
|
1.048
|
1.006
|
|
(0.037)
|
(0.085)
|
(0.040)
|
(0.043)
|
|
Jun
|
1.215‡
|
1.049
|
1.055
|
0.986
|
|
(0.066)
|
(0.072)
|
(0.048)
|
(0.030)
|
|
Jul
|
1.082
|
1.105
|
1.055
|
1.028
|
|
(0.099)
|
(0.075)
|
(0.052)
|
(0.033)
|
|
Aug
|
1.148
|
1.137*
|
1.102*
|
1.051
|
|
(0.086)
|
(0.068)
|
(0.054)
|
(0.037)
|
|
Sep
|
1.092
|
1.116
|
0.929†
|
0.906‡
|
|
(0.079)
|
(0.065)
|
(0.024)
|
(0.017)
|
|
Oct
|
1.007
|
1.049
|
0.898‡
|
0.883‡
|
|
(0.106)
|
(0.092)
|
(0.020)
|
(0.016)
|
|
Nov
|
1.085
|
1.096
|
1.061†
|
1.050*
|
|
(0.059)
|
(0.068)
|
(0.022)
|
(0.021)
|
|
Dec
|
1.039
|
1.043
|
0.992
|
0.970
|
|
(0.039)
|
(0.025)
|
(0.023)
|
(0.024)
|
|
Ramadan
|
1.333†
|
1.578‡
|
1.439‡
|
1.514‡
|
|
(0.123)
|
(0.154)
|
(0.045)
|
(0.056)
|
|
Experience (100 days)
|
0.974
|
0.954‡
|
0.994
|
0.986
|
|
(0.014)
|
(0.010)
|
(0.014)
|
(0.012)
|
|
Institution name (Barka)
|
|
Bawshar
|
|
0.330‡
|
|
0.434‡
|
|
|
(0.014)
|
|
(0.020)
|
|
Al Buraymi
|
|
0.204‡
|
|
1.098
|
|
|
(0.017)
|
|
(0.086)
|
|
Ibri
|
|
0.208‡
|
|
1.103
|
|
|
(0.014)
|
|
(0.061)
|
|
Al Khaburah
|
|
1.068
|
|
1.799‡
|
|
|
(0.048)
|
|
(0.070)
|
|
Al Musanaah
|
|
0.204‡
|
|
0.983
|
|
|
(0.004)
|
|
(0.029)
|
|
Nizwa
|
|
0.244‡
|
|
1.082*
|
|
|
(0.011)
|
|
(0.038)
|
|
A'Rustaq
|
|
0.711*
|
|
1.777‡
|
|
|
(0.098)
|
|
(0.137)
|
|
A'Seeb
|
|
1.950‡
|
|
0.923
|
|
|
(0.092)
|
|
(0.060)
|
|
Shinas
|
|
0.384‡
|
|
1.776‡
|
|
|
(0.009)
|
|
(0.036)
|
|
Sohar
|
|
0.574‡
|
|
1.697‡
|
|
|
(0.036)
|
|
(0.120)
|
|
A'Suwayq
|
|
0.671‡
|
|
1.472‡
|
|
|
(0.060)
|
|
(0.155)
|
|
N
|
507 210
|
507 210
|
810 409
|
797 583
|
The numbers represent the exponentiated coefficients (i.e., odds ration) and robust standard errors in parentheses. All standard errors are clustered on EHCs. The variables in parentheses in the first column are the base category. The EHC with < 5.0% of their visits as appointments (i.e., Jaalan and Sur EHCs) are excluded from these models. We reran the same models with all EHCs included, and the results did not change significantly. The regression models also include fifth-order polynomial in waiting time, which we display in Appendix 7 based on model 2 for each appointment type. EHCs: extended health centers; OPT: ophthalmology clinic; DERM: dermatology clinic; ENT: ear, nose, and throat clinic; * p < 0.050; †p < 0.001; ‡p < 0.001.
 Appendix 4: Adjusted predictions of the probability of no-shows with 95% CIs at different waiting times (0–12 months) estimated at the means of covariates for females and males separately.
Appendix 5: Summary of two logistic regression models of the probability of no-show for new and follow-up appointments separately excluding the EHCs that have < 5.0% of their visits as appointments.
|
Age (years)
|
0.998*
|
0.998*
|
0.997†
|
0.997†
|
|
(0.001)
|
(0.001)
|
(0.001)
|
(0.001)
|
|
Clinic (DERM)
|
|
OPT
|
1.102
|
1.077
|
0.956
|
0.962
|
|
(0.134)
|
(0.104)
|
(0.118)
|
(0.107)
|
|
ENT
|
1.141
|
1.096
|
0.964
|
0.936
|
|
(0.122)
|
(0.068)
|
(0.109)
|
(0.079)
|
|
Appointment type (follow-up)
|
|
New
|
2.726†
|
3.059‡
|
2.829‡
|
3.091‡
|
|
(0.891)
|
(0.877)
|
(0.876)
|
(0.850)
|
|
Appointment time (07:00 – 9:30 am)
|
|
9:30 am –12:00 pm
|
0.866†
|
0.929
|
0.861‡
|
0.900
|
|
(0.042)
|
(0.064)
|
(0.037)
|
(0.059)
|
|
12:00 pm – 2:30 pm
|
0.658‡
|
0.777
|
0.675‡
|
0.766*
|
|
(0.054)
|
(0.102)
|
(0.047)
|
(0.100)
|
|
Appointment month (Jan)
|
|
Feb
|
0.901‡
|
0.893‡
|
0.889‡
|
0.884‡
|
|
(0.026)
|
(0.027)
|
(0.026)
|
(0.027)
|
|
Mar
|
1.004
|
0.997
|
0.965
|
0.959
|
|
(0.032)
|
(0.034)
|
(0.038)
|
(0.041)
|
|
Apr
|
1.110‡
|
1.089†
|
1.055*
|
1.032
|
|
(0.030)
|
(0.034)
|
(0.022)
|
(0.025)
|
|
May
|
1.078*
|
1.013
|
1.083*
|
1.026
|
|
(0.035)
|
(0.044)
|
(0.036)
|
(0.042)
|
|
Jun
|
1.105†
|
1.032
|
1.090
|
1.026
|
|
(0.039)
|
(0.022)
|
(0.048)
|
(0.027)
|
|
Jul
|
1.032
|
1.039
|
1.083
|
1.089*
|
|
(0.058)
|
(0.040)
|
(0.061)
|
(0.038)
|
|
Aug
|
1.096
|
1.057*
|
1.143*
|
1.118†
|
|
(0.052)
|
(0.028)
|
(0.061)
|
(0.043)
|
|
Sep
|
0.988
|
0.988
|
0.985
|
0.982
|
|
(0.039)
|
(0.030)
|
(0.045)
|
(0.035)
|
|
Oct
|
0.938
|
0.948
|
0.936
|
0.945
|
|
(0.038)
|
(0.031)
|
(0.052)
|
(0.046)
|
|
Nov
|
1.080†
|
1.091‡
|
1.068
|
1.077
|
|
(0.030)
|
(0.029)
|
(0.042)
|
(0.042)
|
|
Dec
|
1.014
|
1.010
|
1.001
|
1.004
|
|
(0.022)
|
(0.020)
|
(0.035)
|
(0.022)
|
|
Ramadan
|
1.485‡
|
1.567‡
|
1.319‡
|
1.389‡
|
|
(0.058)
|
(0.078)
|
(0.049)
|
(0.071)
|
|
Experience (100 days)
|
0.989
|
0.976*
|
0.986
|
0.976*
|
|
(0.013)
|
(0.010)
|
(0.013)
|
(0.010)
|
|
Institution name (Barka)
|
|
|
|
|
|
Bawshar
|
|
0.459‡
|
|
0.465‡
|
|
|
(0.026)
|
|
(0.030)
|
|
Al Buraymi
|
|
0.601‡
|
|
0.593‡
|
|
|
(0.046)
|
|
(0.049)
|
The numbers represent the exponentiated coefficients (i.e., odds ration) and robust standard errors in parentheses. All standard errors are clustered on EHCs. The variables in parentheses in the first column are the base category. The EHCs with < 5.0% of their visits as appointments (i.e., Jaalan and Sur EHCs) are included in these models. NA = coefficient cannot be estimated (not available), due to the very small number of observations (Jaalan has zero observation of no-show for new appointments) and perfect collinearity with waiting time and other variables (Sur). The regression models also include fifth-order polynomial in waiting time, which we display in Appendix 7 based on model 2 for each appointment type. EHCs: extended health centers; OPT: ophthalmology clinic; DERM: dermatology clinic; ENT: ear, nose, and throat clinic; * p < 0.050; †p < 0.010; ‡p < 0.001.
Appendix 6: Summary of two logistic regression models of the probability of no-show for new and follow-up appointments separately including all EHCs.
|
Female
|
0.877‡
|
0.894‡
|
0.907‡
|
0.902‡
|
|
(0.027)
|
(0.023)
|
(0.019)
|
(0.019)
|
|
Age (male)
|
0.996†
|
0.996‡
|
0.996†
|
0.996‡
|
|
(0.002)
|
(0.001)
|
(0.001)
|
(0.001)
|
|
Age (female)
|
0.997*
|
0.997*
|
0.998
|
0.998*
|
|
(0.001)
|
(0.001)
|
(0.001)
|
(0.001)
|
|
Clinic (DERM)
|
|
|
|
|
|
OPT
|
1.096
|
1.074
|
0.962
|
0.917
|
|
(0.199)
|
(0.149)
|
(0.104)
|
(0.096)
|
|
ENT
|
1.515*
|
1.187
|
0.898
|
0.933
|
|
(0.263)
|
(0.120)
|
(0.096)
|
(0.074)
|
|
Appointment time (7:00 – 9:30 am)
|
|
9:30 am – 12:00 pm
|
0.815
|
0.880
|
0.905*
|
0.966
|
|
(0.101)
|
(0.100)
|
(0.040)
|
(0.048)
|
|
12:00 pm – 2:30 pm
|
0.476†
|
0.808
|
0.785‡
|
0.972
|
|
(0.125)
|
(0.119)
|
(0.053)
|
(0.047)
|
|
Appointment month (Jan)
|
|
Feb
|
0.927*
|
0.920*
|
0.880‡
|
0.877‡
|
|
(0.029)
|
(0.037)
|
(0.027)
|
(0.023)
|
|
Mar
|
1.051
|
1.049
|
0.954
|
0.950
|
|
(0.033)
|
(0.042)
|
(0.037)
|
(0.036)
|
|
Apr
|
1.163‡
|
1.099*
|
1.048
|
1.028
|
|
(0.038)
|
(0.044)
|
(0.039)
|
(0.043)
|
|
May
|
1.165‡
|
1.013
|
1.048
|
1.007
|
|
(0.037)
|
(0.085)
|
(0.040)
|
(0.043)
|
|
Jun
|
1.220‡
|
1.049
|
1.055
|
0.987
|
|
(0.065)
|
(0.072)
|
(0.048)
|
(0.029)
|
|
Jul
|
1.088
|
1.105
|
1.055
|
1.028
|
|
(0.098)
|
(0.075)
|
(0.052)
|
(0.033)
|
|
Aug
|
1.153
|
1.137*
|
1.102*
|
1.053
|
|
(0.085)
|
(0.068)
|
(0.054)
|
(0.037)
|
|
Sep
|
1.094
|
1.116
|
0.929†
|
0.907‡
|
|
(0.078)
|
(0.065)
|
(0.024)
|
(0.016)
|
|
Oct
|
1.010
|
1.049
|
0.898‡
|
0.884‡
|
|
(0.105)
|
(0.092)
|
(0.020)
|
(0.016)
|
|
Nov
|
1.089
|
1.096
|
1.061†
|
1.051*
|
|
(0.058)
|
(0.068)
|
(0.022)
|
(0.020)
|
|
Dec
|
1.043
|
1.043
|
0.992
|
0.970
|
|
(0.039)
|
(0.025)
|
(0.023)
|
(0.024)
|
|
Ramadan
|
1.335†
|
1.578‡
|
1.439‡
|
1.514‡
|
|
(0.122)
|
(0.154)
|
(0.045)
|
(0.055)
|
|
Experience (100 days)
|
0.974
|
0.954‡
|
0.994
|
0.986
|
|
(0.014)
|
(0.010)
|
(0.014)
|
(0.011)
|
|
Institution name (Barka)
|
|
|
|
|
|
Bawshar
|
|
0.330‡
|
|
0.433‡
|
|
|
(0.014)
|
|
(0.020)
|
|
Al Buraymi
|
|
0.204‡
|
|
1.098
|
|
|
(0.017)
|
|
(0.086)
|
|
Ibri
|
|
0.208‡
|
|
1.103
|
|
|
(0.014)
|
|
(0.061)
|
|
Jaalan
|
|
NA
|
|
2.706‡
|
|
|
|
|
(0.110)
|
|
Al Khaburah
|
|
1.068
|
|
1.799‡
|
|
|
(0.048)
|
|
(0.070)
|
|
Al Musanaah
|
|
0.204‡
|
|
0.983
|
|
|
(0.004)
|
|
(0.029)
|
|
Nizwa
|
|
0.244‡
|
|
1.082*
|
|
|
(0.011)
|
|
(0.038)
|
|
A'Rustaq
|
|
0.711*
|
|
1.777‡
|
|
|
(0.098)
|
|
(0.136)
|
|
A'Seeb
|
|
1.950‡
|
|
0.923
|
|
|
(0.092)
|
|
(0.060)
|
|
Shinas
|
|
0.384‡
|
|
1.776‡
|
|
|
(0.009)
|
|
(0.035)
|
|
Sohar
|
|
0.574‡
|
|
1.697‡
|
|
|
(0.036)
|
|
(0.119)
|
|
Sur
|
|
NA
|
|
NA
|
|
A'Suwayq
|
|
0.671‡
|
|
1.472‡
|
|
|
(0.060)
|
|
(0.154)
|
|
N
|
508 180
|
507 210
|
810 409
|
798 347
|
The numbers represent the exponentiated coefficients (i.e., odds ration) and robust standard errors in parentheses. All standard errors are clustered on EHCs. The variables in parentheses in the first column are the base category. The EHCs with < 5.0% of their visits as appointments (i.e., Jaalan and Sur EHCs) are included in these models. NA = coefficient cannot be estimated (not available), due to the very small number of observations (Jaalan has zero observation of no-show for new appointments) and perfect collinearity with waiting time and other variables (Sur). The regression models also include fifth-order polynomial in waiting time, which we display in Appendix 7 based on model 2 for each appointment type. EHCs: extended health centers; OPT: ophthalmology clinic; DERM: dermatology clinic; ENT: ear, nose, and throat clinic; * p < 0.050; †p < 0.010; ‡p < 0.001
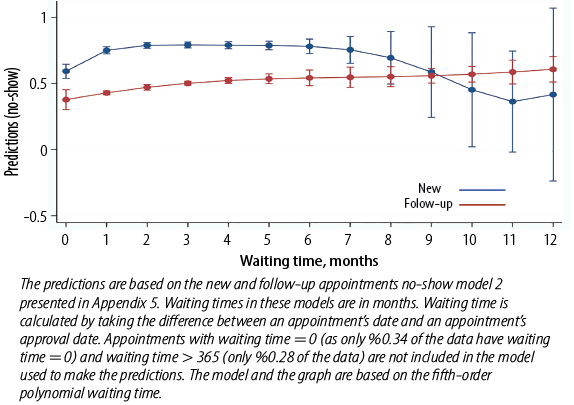 Appendix 7: Adjusted predictions of the probability of no-shows with 95% CIs at different waiting times (0–12 months) estimated at the means of covariates for new and follow-up appointments separately.