In most countries, the population is becoming older owing to increased life expectancy.1 Thus, aging has become one of the challenges in the 21stcentury.2 Older adults are considered a specific group in the community since significant changes occur in the human body with age making older people more prone to impairments.3 Among these impairments are gait disorders including shuffling, imbalance, frequent falls, freezing, and staggering4 eventually leading to fallings and injuries.5 It was found that 27% of old people’s referrals to the emergency department are due to falls. Moreover, this number will reach 40% by 2050 with the increasing aging population.6 No national study has been conducted in Iran to determine the level of fear of fall (FoF) and the frequency. These challenges are both major concerns among older adults’ daily living and physical activity in healthcare systems worldwide.7,8 It decreases the quality of life, thus raising the economic consequences and old-age dependency ratio.9–12 The FoF is one of the main causes of falling, which is stated as fear of falling in the future.5 In fact, FoF is more than a psychological consequence owing to the past fallings. Recent studies have focused on the question, which always occurs first, falling or FoF?13 However, studies have mainly focused on the experience of falling rather than FoF.14 Between 20% to 39% of the individuals with previous falling experience possess a greater FoF.15 As a syndrome,16 the FoF was occasionally reported in older persons without any falling history.16,17 FoF is insignificantly observed in all society members; however, this fear increases with age.
Towards the end of life, the prevalence of FoF was estimated12 within 20–60%.17 An individual’s confidence in his balance is reduced by FoF;18 thus limiting the physical activities and some activities of daily living (ADL) at the end of life.19 Moreover, the old-age dependency ratio is increased disrupting his/her social relationships and thus social isolation.20 Falls Efficacy Scale-International (FES-I) is one of the most extensively utilized tools to measure the FoF, which has two versions with 16 and seven items. Our study sought to determine and validate the psychometric indices of the new FES-I version (short version) in the old population of Iran. The short FES-I version is not validated nationally in Iran and is more appropriate for randomized controlled trials (RCTs) and clinical settings.21–23
Methods
This cross-sectional analytical study was performed for instrumental and psychometric validation. Farzanegan Daily Caring Foundation (FDCF) in the south of Iran was chosen as the community for the study, which includes 17 500 members > 60 years old. The psychometric study of Auais19 was considered based on area under the curve (AUC) index (≥ 0.85), alpha (type I error) 0.05, beta (type II error - power) 0.98 with higher sensitivity and specificity of 90% (specificity and sensitivity fixed at ≥ 0.90). The sample size was considered as 9120 participants with a dropout of 25% utilizing PASS software V.15, 2021 (NCSS Ltd. Co., Kaysville, Utah, USA).24,25 This sample size was selected in the population of the FDCF, by entering the eligible older participants’ names into Microsoft Excel, 2010. The individuals were categorized under a code based on the inclusion criteria. Then, a random table was selected to choose the sample.
Participants were included in the study if the following criteria were met: aged 60 and above, no effective cognitive impairment through Montreal Cognitive Assessment’s score +26 for assessment of cognitive disorders (range = 0–30), ability to communicate with interviewers and have the verbal ability, willingness to participate in the study, and being a permanent member of FDCF. Participants were excluded from the study if they died in the study period, left the FDCF, non participation as per the decision of the physician because of severe illness, unwillingness to participate, and leaving the interview.
A demographic questionnaire included sex, age, level of education, marital status, chronic illness, ADL, aging in place (AiP), hospitalization caused by falling (HF), and its rates (HR). Depression and anxiety were screened through Geriatric Depression Scale and Geriatric Anxiety Inventory (GAI). During the study, three participants died. The FES-I is globally utilized to measure FoF. It has two versions including the long version with 16 items and the short version with seven items.26,27 The reliability and validity of the long version were investigated and approved in several studies.26–28 The long version was hard to answer by the older persons owing to more questions. Thus, the short version of FES-I was recently designed and validated.29 Its items represent fear of getting undressed or dressed, taking a shower or bath, going up or downstairs, getting in or out of a chair, walking up or down a slope, reaching for something above your head or on the ground, and going out for a social event. The four-option answers were within the range “not at all concerned1” to “very concerned5”, with the scoring range of 7–28. A high FoF is represented by the highest score, 28. The short version has not yet been extensively validated in the Iranian aging community. In addition to completing the FES-I, seven items, the samples also completed UCLA Loneliness, SHARE frailty, Geriatric Depression Inventory, GAI, and AiP in the second half of 2021.
Using the protocol of the World Health Organization, the research tools were translated/back-translated and validated after making the arrangements and obtaining permission from the FES-I’s designers. Based on this protocol, two independent Persian translators translated the original English version of the scale initially. Then, the FES-I were assessed, and an agreed version was achieved through a meeting with translators. The questionnaire’s face validity was studied during an interview with 10 older literate samples (with at least a bachelor’s degree). The participants were requested to review the difficulty level and the ambiguity and appropriateness of the seven items. They were also asked to submit any suggestions to clarify the items’ ambiguity. By confirming the face validity, the content validity ratio (CVR) and then the content validity index (CVI) were used to assess content validity. Based on the Lawshe Table, using 10 evaluators yields the acceptable CVR limit of 0.60. Likewise, the validity index of the overall content of the tool is determined by the items’ mean validity index.30 We found the CVI of ≥ 90% for each item and 94% for the whole scale. A copy of the questionnaire was sent to each translator and translated into English after proving the content and face validities. The English versions were obtained under the supervision of two academic members of the institute and a single version was extracted, which had the most alignment with the original version. For final approval, it was then returned to the original designer. The FES-I and other tools were completed and received by 9117 participants in the next stage.
Entering the data into SPSS (IBM Corp. Released 2021. IBM SPSS Statistics for Windows, Version 28.0. Armonk, NY: IBM Corp.) exploratory factor analysis (EFA) technique was utilized by Varimax and Quartimax rotation and scree plot to determine the construct validity in the first stage and identify the factors scales.31 For utilizing the EFA method, the assumptions should be examined including the Kaiser-Meyer-Olkin test (KMO) for adequacy of the sample sizes, normality of data, and Bartlett’s test of sphericity. Then, an observed correlation matrix was compared with the identity matrix.31 This validity was assessed by confirmatory factor analysis (CFA) in the second stage and principal component analysis (PCA) to examine the model fit indices. In the third stage, McDonald’s omega, Cronbach’s alpha, and Pearson correlation were used to test the FES-I internal consistency. Also, to assess the instrument’s internal reliability, the intra-cluster correlation coefficient (ICC) was examined. Finally, receiver operating characteristic (ROC) analysis, DIFF, Youden’s J, and D value were used to determine the FES-I seven items cut-off points. The current study was based on the Helsinki Convention (2013) as well as the STROBE checklist. It was approved by the Ethics Committee of Shiraz University of Medical Sciences (IR.SUMS.SCHEANUT.REC.1401.009). Oral and written informed consent was acquired from all the participants.
Results
The older persons (9117 participants) had a mean age of 70.2±8.3 years (54.1% female and 45.9% male) and the highest frequent education level was no formal schooling (47.7%). About 43.0% were widows. Approximately 72.4% lived alone and 93.0% had a falling experience in the past two years. The mean±SD score of HR per year caused by falling was 401.0±0.02 (66% ≥ 4 times per year, no difference was found between males and females, p = 0.075). About 93.0% and mostly women needed support in ADL (56.1%). Approximately 97.0% were covered by the pensioning system. The mean (SD) score of FES-I was 19.8 (4.6) (range = 7–28), which was higher among the participants. Among the oldest samples, this score was higher (+80), with a mean score of 27.7±0.7. The older samples’ loneliness and anxiety were also calculated in addition to FES-I and the mean scores were obtained as 2.5 (range = 0.5, SD = 1.6) and 61.6 (range = 20–80, SD = 7.6), respectively. It was also indicated the results of analysis of variance could clarify the effect of each demographic and health variables size on the total score of FES-I, short version. Table 1 shows the effect size via partial Eta squared as 88.0% for AiP, 99.0% for the age, 93.0% for HR, 83.0% for loneliness, 24.0% for need for ADL, 87.0% for frailty, and 8.02% for sense of anxiety. Moreover, no statistically significant difference was found between older women and men in FES-I (p ≥ 0.05).
Table 1: The one-way analysis of variance for health and demographic factors (N = 9117, p ≤ 0.05).
|
Age per year
|
Between groups
|
70.2 (8.3)
|
188261.3
|
40
|
4706.5
|
24764.245
|
0.991
|
0.001
|
|
Within groups
|
|
1724.9
|
9076
|
0.1
|
|
|
|
|
Total
|
|
189986.2
|
9116
|
|
|
|
|
|
Aging in place
|
Between groups
|
64.3 (24.5)
|
166958.8
|
78
|
2140.4
|
840.120
|
0.879
|
0.001
|
|
Within groups
|
|
23027.4
|
9038
|
2.5
|
|
|
|
|
Total
|
|
189986.2
|
9116
|
|
|
|
|
|
Hospitalization rate
|
Between groups
|
4.1 (1.5)
|
175834.4
|
7
|
25119.2
|
16168.229
|
0.926
|
< 0.001
|
|
Within groups
|
|
14151.8
|
9109
|
1.5
|
|
|
|
|
Total
|
|
189986.2
|
9116
|
|
|
|
|
|
Need to activities of daily living
|
Between groups
|
16.7 (2.6)
|
44963.4
|
1
|
44963.4
|
2826.047
|
0.237
|
0.001
|
|
Within groups
|
|
145022.8
|
9115
|
15.910
|
|
|
|
|
Total
|
|
189986.2
|
9116
|
|
|
|
|
|
Loneliness
|
Between groups
|
61.6 (7.6)
|
158506.5
|
31
|
5113.1
|
1475.638
|
0.834
|
0.001
|
|
Within groups
|
|
31479.7
|
9085
|
3.4
|
|
|
|
|
Total
|
|
189986.2
|
9116
|
|
|
|
|
|
Sense of anxiety
|
Between groups
|
2.5 (0.5)
|
155002.6
|
5
|
31000.5
|
8073.646
|
0.816
|
< 0.001
|
|
Within groups
|
|
34983.6
|
9111
|
3.8
|
|
|
|
|
Total
|
|
189986.2
|
9116
|
|
|
|
|
|
Frailty
|
Between groups
|
2.9 (1.4)
|
165263.5
|
4
|
41315.8
|
15227.709
|
0.870
|
< 0.001
|
|
Within groups
|
|
24722.7
|
9112
|
2.7
|
|
|
|
The skewness score was between ± 1, for which an acceptable amount was considered as < 2 by Tabachnick and Fidell,32 indicating the normality of distribution for the data. The correlation matrix represented most correlations > 0.41. Moreover, the KMO value was 0.906 (p < 0.001), which was higher than the recommended threshold of 0.6.33 The construct validity of FES-I was based on EFA utilizing four extracting models including generalized least squares (GLS), PCA, unweighted least squares (ULS), and maximum likelihood (ML) with equamax and varimax rotation. Since only one component was extracted, the solution could not be rotated. The Eigenvalue was 75.7, and the total explained variance was 67.4%. The mean factor and communalities scores for the items were 0.65 and 0.504, respectively.
In the next stage, CFA was conducted utilizing AMOS-24 to evaluate the one-factor structure presented in the former step.16 As seen in Table 2, considering the main goodness of fit indices, the FES-I factor structure for the obtained model was good. Moreover, the chi-square was significant (p < 0.001). The AGFI was 0.90 along with the relative chi-square of 9.69, Tucker–Lewis index of 0.95, IFI of 0.92, NNFI of 0.90, CFI of 0.90, GFI of 0.90, and RMSEA of 0.005. Furr recommended that the CFA fit indices need to include standardized loadings of ≥ 0.80.34 Figure 1 shows the final explained model.
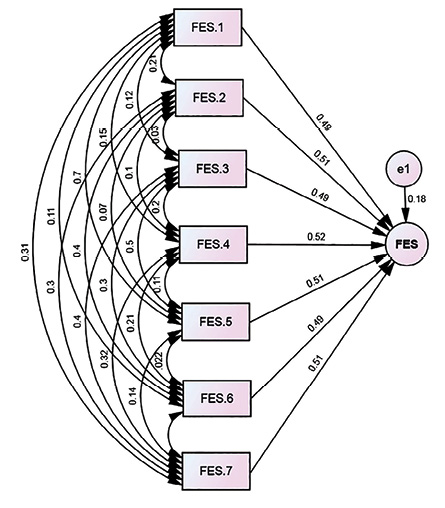 Figure 1: Path diagram for the confirmatory factor analysis of Falls Efficacy Scale-International (FES-I) seven items.
Table 2: The goodness of the extracted model’s fit indices for the FES-I seven items.
FES-I: Falls Efficacy Scale-International; AGFI: adjusted goodness of fit index; GFI: goodness of fit index; RMSEA: root mean square error of approximation;
IFI: incremental fit index; NNFI: non-normed fit index; TLI: Tucker–Lewis index; CFI: confirmatory fit index.
In Table 3, a comparison was made on the convergent validity of FES-I seven items and Iranian versions of UCLA Loneliness (0.84), GAI (0.90), as well as SHARE frailty (0.93) (p < 0.001).
Table 3: The Pearson’s correlation coefficient between items of FES-I and total score.
|
Item_1
|
1
|
|
|
|
|
|
|
|
|
|
|
Item_2
|
0.41**
|
1
|
|
|
|
|
|
|
|
|
|
Item_3
|
0.41**
|
0.42**
|
1
|
|
|
|
|
|
|
|
|
Item_4
|
0.42**
|
0.43**
|
0.43**
|
1
|
|
|
|
|
|
|
|
Item_5
|
0.41**
|
0.43**
|
0.42**
|
0.42**
|
1
|
|
|
|
|
|
|
Item_6
|
0.41**
|
0.42**
|
0.41**
|
0.41**
|
0.41**
|
1
|
|
|
|
|
|
Item_7
|
0.43**
|
0.42**
|
0.42**
|
0.44**
|
0.42**
|
0.42**
|
1
|
|
|
|
** Correlation is significant at the 0.010 level (two-tailed).*** Correlation is significant at the 0.001 level (two-tailed).
FES-I: Falls Efficacy Scale-International; GAI: Geriatric Anxiety Inventory; UCLA: University of California, Los Angeles.
The seven items demonstrated the internal consistency of moderate to high between the items and with the total score [Table 4]. The significance level for all the path coefficients was p < 0.010. The FES-I scale represented excellent reliability. The Cronbach’s alpha was 0.94 along with the McDonald’s omega of 0.84 for the entire scale (p < 0.001), Fleiss’ kappa of 0.73, ICC of 0.81, and weighted kappa of 0.75.
Table 4: The AUC, sensitivity, specificity, and Youden’s J index for possible cut-off points of FES-I seven items.
|
FES-I (Men)
|
0.707
|
0.691
|
0.720
|
19.8 (4.6)
|
0.001
|
15.0
|
0.845
|
0.754
|
0.600
|
0.216
|
0.091
|
|
FES-I (Women)
|
0.721
|
0.711
|
0.745
|
19.8 (4.5)
|
< 0.001
|
15.5
|
0.840
|
0.748
|
0.601
|
0.224
|
0.092
|
|
No need to ADL
|
0.547
|
0.473
|
0.622
|
11.8 (2.3)
|
0.002
|
15.5
|
0.751
|
0.982
|
0.733
|
0.249
|
0.231
|
|
Need to ADL
|
0.751
|
0.741
|
0.763
|
20.4 (4.1)
|
0.002
|
18.5
|
0.830
|
0.573
|
0.403
|
0.352
|
0.257
|
|
HF (No)
|
0.961
|
0.947
|
0.975
|
11.2 (0.9)
|
< 0.001
|
10.0
|
0.989
|
0.595
|
0.584
|
0.175
|
0.394
|
|
HF (Yes)
|
0.761
|
0.750
|
0.772
|
20.5 (4.1)
|
< 0.001
|
18.0
|
0.836
|
0.534
|
0.370
|
0.381
|
0.302
|
|
HR (≤ 3)
|
0.931
|
0.918
|
0.943
|
14.49 (2.1)
|
0.001
|
15.5
|
1.000
|
0.856
|
0.921
|
0.856
|
0.777
|
aTwo-sided Chi-squared test, p ≤ 0.05; DIFF = abs (sensitivity– specificity); D Value or K-Index = Sqrt ((1-Sensitivity)2 + (1-Specificity)2)35; Independent-group area difference under the ROC Curve = -0.014 (p < 0.003); ACU: area under the curve; ADL: activities of daily living; HF: history of falling experience in the past two years; HR: hospitalization rate per year due to falling.
Table 4 represents the AUC, the specificity, the sensitivity, as well as the cut-off points for the FES-I 7-item. As shown, the cut-off point of the best differentiates with FoF and without it in women and men was 15.5 and 15.0, respectively. Youden’s J, D value (Euclidean distance), and DIFF indices are used to diagnose the best cut-off point of the tests and assess the biomarker effectiveness.34 The Youden’s J close to 1 while D value and DIFF close to 0 indicate the optimal cut-point value. According to Table 4, the estimated cut-off points are applicable.35,36
According to the ROC curve, the independent-group area differences for men-women, with/without ADL, HF, and HR (yes and no) were -0.314, -0.204, 0.201, and -0.322, respectively (p < 0.001). According to Kisvetrová et al,37 the groups had perfect discrimination (no overlap in the two distributions) and the ROC plot passed through the upper left corner. It was indicated that the FES-I, the specific cutting points of each group should be separately considered along with the two groups’ powerful discrimination.
Discussion
We studied the psychometric features of the FES-I short version and its cut-off points to older samples’ health levels in Iran. We found an acceptable internal consistency, accuracy, reliability, structure, and convergent validity for this work (p ≤ 0.050). The acceptability results represented the fixed effects of loneliness, anxiety, frailty, AiP, age per year, and HR with an effect size of > 0.80 on aging FoF, except ‘need to ADL’ (< 0.30) (p ≤ 0.001). The structure analysis included the items in one factor with an Eigenvalue close to 1. Moreover, the extracted models were PCA, ULS, GLS, and ML. It was found that this one-factor model was the best by fit indices (mean of indices ≥ 0.9) and the RMSEA< 0.05 (p = 0.010).
High internal consistency of FES-I was found in the results, like previous studies38–39 of the long version including an acceptable inter-item correlation as McDonald’s omega = 0.84 and ICC = 0.81. For assessing the inter-rater and test-retest reliability, a good consistency was found between the results and the original version of FES-I, CVI-CVR ≥ 0.6. It also has enough accuracy for use in clinical trials and studies with acceptable SEM. Furthermore, investigating the convergent validity revealed a moderate to high correlation between the total score of FES-I, which was consistent with other instruments in the similar studies such as SHARE frailty40,41, GAI42,43 and UCLA Loneliness44–46 except GDS, which was not statistically significant (p = 0.675).
The results of the ROC analysis revealed the adequate discriminative validity of the total FES-I score to classify various demographic levels and health statuses (male/female, with/without ADL, HF, and HR). The results revealed that the cut-off point was 15.0 and 15.5 for older men and women, 15.5 represented no need for ADL from the need to ADL with 10.0. Moreover, the cut-off points of 18.0 differentiates having HF from no HF experience with 10.0, and 19.5, HR (≥ 4) from HR (≤ 3) with 15.5 (all with a sensitivity of > 0.75). Researchers and clinicians can use cut-off points for designing personalized treatment plans and RCTs for the older persons, by recognizing the features like the FoF level. Proper diagnosis and relevant treatment are not provided for the oldest adults with FoF since their amount of FoF is not measured accurately, which is highly suffering for them. Hence, complete identification of FoF can improve their life quality. The results of our study have similar points to the current version of FES-I (short version) in other languages (i.e., Arabic, Cantonese in mainland of China, Portuguese, Taiwanese, Japanese, Igbo, and Czech) in psychometric properties. These studies have not attended to the cut-off points of a short version of FES-I, whereas this paper has extracted the scores on gender base, HF experience, and experience of hospitalization. The Mandarin and Bahasa Melayu versions of FES-I have indicated the different distribution of items and factor loading from the results of our study as well.47–52
Conclusion
We assessed the psychometric features of the short version of FES-I. According to our findings, the Persian version of FES-I is a reliable and valid instrument to measure older adults’ FoF in clinical and community sceneries. Furthermore, levels of FoF are categorized by this scale in terms of severity. Further studies are required to validate FES-I in various sub-cultures in Iran. Adequate precautions should be considered while generalizing the results of our study to other populations and RCTs, particularly about the cut-off point score. The age classification was not considered in the inclusion criteria, which could be considered a limitation of our study. Hence, it was suggested to consider old-old persons (+80) in future research. Besides, the women’s specific biology and the higher falling prevalence among them at the end of life were considered. In the present work, an important part of the samples was aging females. However, the specific cut-off points and uses of this tool in various sub-groups of older women such as older people with cognitive disorders, older adults living in nursing homes, and someone who had a history of falls must be examined in future studies.
Disclosure
The authors declared no conflicts of interest. No funding was received for this study.
Acknowledgments
Our warm thanks go to the Research and Technology Department of Shiraz University of Medical Sciences, as well as older people who are permanent members of Farzanegan Daily Caring Foundation for their patience and participation in
the study.
references
- McManus K, Greene BR, Ader LG, Caulfield B. Development of data-driven metrics for balance impairment and fall risk assessment in older adults. IEEE Trans Biomed Eng 2022 Jul;69(7):2324-2332.
- Safarkhanlou H, Rezaei Ghahroodi Z. The evolution of the elderly population in Iran and the world. Statistics J. 2017;5(3):8-16. (in Persian)
- 3. Mabry RM, Morsi M, Owen N. Descriptive epidemiology of sitting time in Omani men and women: a known risk factor for non-communicable diseases. Oman Med J 2017 May;32(3):233-239.
- 4. Cuevas-Trisan R. Balance problems and fall risks in the elderly. Phys Med Rehabil Clin N Am 2017 Nov;28(4):727-737.
- 5. Chen SK, Voaklander D, Perry D, Jones CA. Falls and fear of falling in older adults with total joint arthroplasty: a scoping review. BMC Musculoskelet Disord 2019 Dec;20(1):599.
- 6. Vogelsang EM, Raymo JM, Liang J, Kobayashi E, Fukaya T. Population aging and health trajectories at older ages. J Gerontol B Psychol Sci Soc Sci 2017 Oct;72(6):1111-1112.
- 7. Alqahtani BA, Alenazi AM. Cross-cultural adaptation and psychometric properties of the Arabic version of the rapid assessment of physical activity. Oman Med J 2020 Sep;2020(5):e170.
- 8. Al-Ghafri TS, Al-Harthi SM, Al-Farsi Y, Craigie AM, Bannerman E, Anderson AS. Perceived changes in general well-being: findings from the ‘movediabetes’ physical activity randomized control trial. Oman Med J 2020 Jul;35(4):e149.
- 9. Gazibara T, Kurtagic I, Kisic-Tepavcevic D, Nurkovic S, Kovacevic N, Gazibara T, et al. Falls, risk factors and fear of falling among persons older than 65 years of age. Psychogeriatrics 2017 Jul;17(4):215-223.
- 10. Vitorino LM, Teixeira CA, Boas EL, Pereira RL, Santos NO, Rozendo CA. Fear of falling in older adults living at home: associated factors. Rev Esc Enferm USP 2017 Apr;51:e03215.
- 11. Schoene D, Heller C, Aung YN, Sieber CC, Kemmler W, Freiberger E. A systematic review on the influence of fear of falling on quality of life in older people: is there a role for falls? Clin Interv Aging 2019 Apr;14:701-719.
- 12. İleri İ, Borazan FY, Cavusoglu C, Göker B. The relationship between the severity of insomnia and falls in the elderly. Psychogeriatrics 2022 Jan;22(1):22-28.
- 13. Turunen KM, Kokko K, Kekäläinen T, Alén M, Hänninen T, Pynnönen K, et al. Associations of neuroticism with falls in older adults: do psychological factors mediate the association? Aging Ment Health 2022 Jan;26(1):77-85.
- 14. Qin Y, Li J, McPhillips M, Lukkahatai N, Yu F, Li K. Association of fear of falling with frailty in community-dwelling older adults: a cross-sectional study. Nurs Health Sci 2021 Jun;23(2):516-524.
- 15. Whipple MO, Hamel AV, Talley KM. Fear of falling among community-dwelling older adults: a scoping review to identify effective evidence-based interventions. Geriatr Nurs 2018 Mar - Apr;39(2):170-177.
- 16. Scheffer AC, Schuurmans MJ, van Dijk N, van der Hooft T, de Rooij SE. Fear of falling: measurement strategy, prevalence, risk factors and consequences among older persons. Age Ageing 2008 Jan;37(1):19-24.
- 17. Makino K, Makizako H, Doi T, Tsutsumimoto K, Hotta R, Nakakubo S, et al. Impact of fear of falling and fall history on disability incidence among older adults: prospective cohort study. Int J Geriatr Psychiatry 2018 Apr;33(4):658-662.
- Allali G, Ayers EI, Holtzer R, Verghese J. The role of postural instability/gait difficulty and fear of falling in predicting falls in non-demented older adults. Arch Gerontol Geriatr 2017 Mar - Apr;69:15-20.
- 20. Auais M, Alvarado BE, Curcio CL, Garcia A, Ylli A, Deshpande N. Fear of falling as a risk factor of mobility disability in older people at five diverse sites of the IMIAS study. Arch Gerontol Geriatr 2016 Sep-Oct;66:147-153.
- Jefferis BJ, Iliffe S, Kendrick D, Kerse N, Trost S, Lennon LT, et al. How are falls and fear of falling associated with objectively measured physical activity in a cohort of community-dwelling older men? BMC Geriatr 2014 Oct;14:114.
- Bjerk M, Brovold T, Skelton DA, Bergland A. A falls prevention programme to improve quality of life, physical function and falls efficacy in older people receiving home help services: study protocol for a randomised controlled trial. BMC Health Services Research 2017 Dec;17(1):1-9.
- 22. Jonasson SB, Nilsson MH, Lexell J. Psychometric properties of four fear of falling rating scales in people with Parkinson’s disease. BMC Geriatr 2014 May;14(1):66.
- 23. Vogel O, Niederer D, Vogt L. Multimodal exercise effects in older adults depend on sleep, movement biography, and habitual physical activity: a randomized controlled trial. Front Aging Neurosci 2021 Oct;13:722799.
- 24. PASS. Power analysis and sample size software. Sample size and power. 2021 [cited 2022 April 15]. Available from: ncss.com/software/pass.
- 25. Obuchowski NA, McClish DK. Sample size determination for diagnostic accuracy studies involving binormal ROC curve indices. Stat Med 1997 Jul;16(13):1529-1542.
- 26. Yardley L, Beyer N, Hauer K, Kempen G, Piot-Ziegler C, Todd C. Development and initial validation of the falls efficacy scale-international (FES-I). Age Ageing 2005 Nov;34(6):614-619.
- 27. Chang KC, Chen HS, Horng YS, Liou HH, Liang HW. Cross-cultural adaptation of the Taiwan Chinese version of the Falls Efficacy Scale-International for community-dwelling elderly individuals. BMC geriatrics. 2022 Nov 19;22(1):881.
- 28. Tinetti ME, Richman D, Powell L. Falls efficacy as a measure of fear of falling. J Gerontol 1990 Nov;45(6):239-243.
- 29. Kempen GI, Yardley L, van Haastregt JC, Zijlstra GA, Beyer N, Hauer K, et al. The Short FES-I: a shortened version of the falls efficacy scale-international to assess fear of falling. Age Ageing 2008 Jan;37(1):45-50.
- 30. Dias N, Kempen GI, Todd CJ, Beyer N, Freiberger E, Piot-Ziegler C, et al. [The German version of the falls efficacy scale-international version (FES-I)]. Z Gerontol Geriatr 2006 Aug;39(4):297-300.
- Zhou XH, McClish DK, Obuchowski NA. Statistical methods in diagnostic medicine. John Wiley and Sons; 2009 Sep 25.
- 32. Tabachnick BG, Fidell LS. Experimental designs using ANOVA. Belmont, CA: Thomson/Brooks/Cole; 2007.
- 33. Kaiser HF. An index of factorial simplicity. Psychometrika. 1974 Mar;39(1):31-6.
- Furr M. Scale construction and psychometrics for social and personality psychology. London: SAGE Publications Ltd; 2011.
- 35. Nahm FS. Receiver operating characteristic curve: overview and practical use for clinicians. Korean J Anesthesiol 2022 Feb;75(1):25-36.
- 36. Larner AJ. Defining ‘optimal’ test cut-off using global test metrics: evidence from a cognitive screening instrument. Neurodegener Dis Manag 2020 Aug;10(4):223-230.
- 37. Kisvetrová H, Školoudík D, Herzig R, Langová K, Kurková P, Tomanová J, et al. Psychometric properties of the Czech version of the falls efficacy scale-international in patients with early-stage dementia. Dement Geriatr Cogn Dis Extra 2019 Aug;9(2):319-329.
- 38. Tan MP, Nalathamby N, Mat S, Tan PJ, Kamaruzzaman SB, Morgan K. Reliability and validity of the short falls efficacy scale International in English, mandarin, and Bahasa Malaysia in Malaysia. Int J Aging Hum Dev 2018 Dec;87(4):415-428.
- Kuo CT, Chen DR, Chen YM, Chen PY. Validation of the short falls efficacy scale-international for Taiwanese community-dwelling older adults: associations with fall history, physical frailty, and quality of life. Geriatr Nurs 2021 Sep-Oct;42(5):1012-1018.
- 40. Honda H, Ashizawa R, Kiriyama K, Take K, Hirase T, Arizono S, et al. Chronic pain in the frail elderly mediates sleep disorders and influences falls. Arch Gerontol Geriatr 2022 Mar;99:104582.
- 41. Argenta C, Zanatta EA, Adamy EK, Lucena AF. Nursing outcomes and interventions associated with the nursing diagnoses: risk for or actual frail elderly syndrome. Int J Nurs Knowl 2022 Jan.
- 42. Stasi S, Tsekoura M, Gliatis J, Sakellari V. Motor control and ergonomic intervention home-based program: a pilot trial performed in the framework of the motor control home ergonomics elderlies’ prevention of falls (McHeELP) project. Cureus 2021 Apr;13(4):e14336.
- 43. Estrêla AT, Machin R. The body in old age and its relationships with falls from the narrative of elderlies. Cien Saude Colet 2021 Nov;26(11):5681-5690.
- 44. Manchana V. Fall risk, a growing burden of physical injury and mental health among seniors: pandemic of fears, anxieties, and loneliness in later life (FALL). Academia Letters; 2021 [cited 2022 April 15]. Available from: https://www.academia.edu/50818766/Fall_risk_a_growing_burden_of_physical_injury_and_mental_health_among_Seniors_Pandemic_of_Fears_Anxieties_and_Loneliness_in_Later_life_FALL_.
- 45. Somes J. The loneliness of aging. J Emerg Nurs 2021 May;47(3):469-475.
- 46. Petersen N, König HH, Hajek A. The onset of falls and its effects on perceived social exclusion and loneliness. Evidence from a nationally representative longitudinal study. Arch Gerontol Geriatr 2022 May-Jun;100:104622.
- 47. Marques-Vieira CM, Sousa LM, Sousa LM, Berenguer SM. Validation of the falls efficacy scale - international in a sample of Portuguese elderly. Rev Bras Enferm 2018;71(Suppl 2):747-754.
- 48. França AB, Low G, de Souza Santos G, da Costa Serafim R, Vitorino LM. Psychometric properties of the falls efficacy scale-international and validating the short version among older Brazilians. Geriatr Nurs 2021 Mar-Apr;42(2):344-350.
- 49. Kamide N, Shiba Y, Sakamoto M, Sato H. Reliability and validity of the short falls efficacy scale-international for Japanese older people. Aging Clin Exp Res 2018 Nov;30(11):1371-1377.
- 50. Lipardo DS, Leung AY, Gabuyo CM, Escuadra CJ, Leung PA, Aseron AM, et al. Cross-cultural adaptation and psychometric properties of the falls efficacy scale - international in Filipino community-dwelling older adults. Disabil Rehabil 2020 May;42(9):1292-1298.
- 51. Abd El Fattah L, Hazzaa N, Naeem F, Eldin HG. Validation of the modified falls efficacy scale–international (FES-I) in Egyptian Geriatric population. Egypt J Hosp Med 2018 Apr;71(1):2294-2303.
- 52. Kwan MM, Tsang WW, Close JC, Lord SR. Development and validation of a Chinese version of the falls efficacy scale international. Arch Gerontol Geriatr 2013 Jan-Feb;56(1):169-174.