Loneliness has a multi-faceted negative impact on daily functioning in children. Child loneliness has been a relatively neglected field compared to other foci, even though loneliness in children is common these days. Approximately one-fifth of eight-year-old children reported loneliness.1 Loneliness among children can have a long-term negative impact on well-being and disrupt their cognitive and social development2 and family relationships.3,4 Parent-child relationship greatly impacts a child’s social and emotional development. Exalted conflict between parent and child is also associated with loneliness. Conflicts between child and parents may have a significant impact on child’s interpersonal, social/emotional adjustment and may lead to resentment and discomfort.5,6
Nationwide lockdown during the COVID-19 pandemic brought the social life of everyone to a standstill. Children were forced to remain home with online teaching and negligible interaction with peers. Parent-child relationships and conflicts were also impacted during the lockdown phase. Thus, we planned to explore whether loneliness can predict parent-child relationship and conflict behavior and to explore the association between these measures during the lockdown in India.
There are various scales to measure these three aspects (i.e., loneliness, parent-child relationship, and conflict behavior). The commonly used and most studied in the literature are the Loneliness and Dissatisfaction Questionnaire (LSDQ), Parent-Child Relationship Questionnaire (PCRQ), and Conflict Behavior Questionnaire (CBQ). These questionnaires exhibit strong qualities that indicate their application: construct and concept validity, ease of use, linguistic adaptation, and international recognition.7–12
LSDQ has been widely used in various studies, and its psychometric properties have been reported from good to excellent. The internal consistency of the original version ranged from 0.87 to 0.90,2 the Greek version was 0.85 for full scale13 and 0.75,14 and in African and Hispanic American 0.79 to 0.8515 and 0.89.16 Satisfactory internal consistency have been reported by Gerdes et al,8 for PCRQ (0.63 to 0.88) and Furman and Giberson (0.83 to 0.84).17 Among African-Americans, internal consistency was reported from acceptable to excellent (range: 0.68–0.92)18 and in two Chinese studies, the internal consistency report was 0.76 to 0.8419 and 0.68 to 88.20 Prinz et al,21 reported adequate internal consistency of CBQ English version (0.88). For the Urdu version, it ranged from 0.73 to 0.89.22
Hindi is the fourth most regularly communicated language internationally, spoken by over 260 million individuals worldwide.23 It is the national language of India, the nation with the second biggest populace on the planet. When scales are not available in the local language, it might be difficult to maintain the cultural veracity of the targeted language for the intended population. We did not find the Hindi version of these instruments to be used for Hindi speaking Indian population, and the non-availability of these scales in the local language is a major limitation. Thus, the initial part of our main study is Hindi translation and cross-language concordance and validation of LSDQ-C, PCRQ-C, and CBQ-C. Cross-language concordance and validating these scales in Hindi would expedite generating data from India. The findings would be comparable worldwide with other findings on the same scales. Thus, our study aimed to translate the English version of the LSDQ-C, PCRQ-C, and CBQ-C into Hindi and explore its psychometric properties.
Methods
We conducted an observational study of children aged 10–18 years of age, studying in either government or private schools of Chandigarh, India. Parents who gave consent for their children to be included in the study were recruited. The children whose parents did not consent and with any organic disorder were excluded.
After obtaining institutional ethics committee approval, permission was sought from the competent authorities (Director Education, Chandigarh Administration) to conduct this online survey. Children from various government and private schools of Chandigarh were enrolled through snowball convenient sampling technique. School principals were contacted through e-mail, WhatsApp, and telephone to explain the objectives of the study. The study population was explained the research objectives and methodology. Consent was taken prior to the enrollment of the participants from their parents. Google forms were sent through email and WhatsApp to the principals. For baseline assessment, Google forms were sent to 300 school students.
We used forward and backward translation and cognitive debriefing by pilot testing for Hindi translation and cross-cultural adaptation for the child versions of the three scales.
The original English versions of the scales were translated into Hindi24 by two experts (psychologists) who were native residents of India and were fluent in writing and speaking English and Hindi. Hindi translation from both the experts was reconciled into one version to make the first draft of the Hindi version of all the scales. The first Hindi draft was then retranslated into English by two different bilingual experts separately. These experts had no prior knowledge about these scales, and they were not even shown the original English versions of the scales. A senior psychologist, fluent in both languages, reviewed the translation with another bilingual expert for any discrepancies in terminology. These issues were resolved to get the refined draft of all the scales. Further, refined versions were discussed and evaluated by all the Hindi and bilingual experts, and a final version was agreed.
After the translation process, translated Hindi versions of all the scales were administered to 12 children of either gender for comprehensibility. In a pilot study, children completed LSDQ-C, PCRQ-C, and CBQ-C. They also described their understanding of scale items and suggested alternative words that were difficult to understand. Participants responses were reviewed by experts, and suggestions from participants were also incorporated. After these modifications, the final Hindi version was locked down for the validation phase [Figure 1].
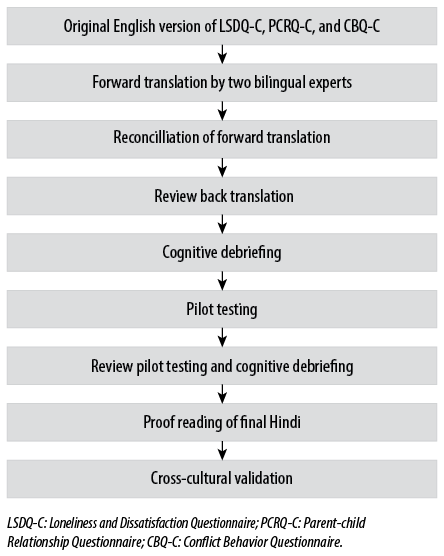
Figure 1: Flow chart of cross-cultural adaptation.
Loneliness and Social Dissatisfaction Questionnaire2 (Asher, Hymel and Renshaw, 1984):2 The questionnaire comprises of 24 items rated on a five-point Likert scale (definitely yes to definitely no) and has child and parent versions. The range of total score is 16–80. Item numbers 6, 9, 12, 17, 20, and 21 are scored reversely, and higher scores are indicative of higher feeling of loneliness, social inadequacy, and poor perceived peer relationship. The Cronbach’s alpha for the child version was 0.89, and for the parent version it was 0.96. The scale also has excellent internal consistency.16
Parent-Child Relationship Questionnaire (Furman and Giberson, 1995).17 Parallel forms measure five factors: warmth, personal relationship, disciplinary warmth, power assertion, and possessiveness. We planned to use the personal relationship domain, which has 10 items and gives a confiscated view of the scale and has strong association with other domains of the scale.17 Items are rated on a five-point Likert scale (hardly at all to extremely much) with a score range of 10–50. The higher the scores, the more intimate the relationship and togetherness between parent and child. The Cronbach’s alpha has been 0.76 for the parent version and 0.91 for the child version. The scale also has good to excellent internal consistency.25
Conflict Behavior Questionnaire (Robin and Foster, 1984).21 The questionnaire has 20 items with a true/false rating and measures the perceived conflict between child and parent interaction at home with two parallel forms for child and parent. High scores indicate negative communication among the child and parent. The scale has good internal consistency (0.94 for children and 0.95 for parents).11 Thus, CBQ 20 is a reliable and valid tool.
According to Hinkin,26 the sample size required to perform exploratory factor analysis should be a sample size to number of item ratio no lower than 4:1. As the LSDQ has 24 items, PCRQ has 10, and CBQ has 20 items, a minimum of 96 cases (24 ×4 = 96) were required. To ensure optimum participation Google forms were sent to 300 children and their parents through school authorities after obtaining permission from the Chandigarh education department. Out of the 300 families approached, 200 responded for baseline assessment, 100 did not respond/give consent, and for test-retest reliability 102 responded out of the 200 families.
Obtained data was analyzed using SPSS Statistics (SPSS Inc. Released 2008. SPSS Statistics for Windows, Version 17.0. Chicago: SPSS Inc.). We used descriptive statistics (frequency, percentage, mean and standard deviation) for demographic variables of the children and parents. Skewedness of the data was also checked, and parametric tests were used for further analysis.
Cross-language concordance and internal consistency was assessed by computing ICC and Cronbach’s alpha for both English and Hindi versions and for baseline and retest observation. Cronbach’s alpha values ≥ 0.9, excellent; ≥ 0.8, good; ≥ 0.7, acceptable; ≥ 0.6, questionable; ≥ 0.5, poor; and ≤ 0.5, unacceptable.27 For ICC, two-way random effect model was used with 95% as class interval, and ICC of ≥ 0.70 was considered acceptable.28 The mean of both the observations were computed using the paired t-test. The Bland Altman plot for LSDQ-C, PCR-C, CBQ-C was used to compare measurement between baseline and retest assessment.
This manuscript is the part of the study approved by the institutional ethics committee with letter no: INT/IEC/2020/SPL-980. Parents were requested to provide written informed consent and were carried out by the Code of Ethics of the World Medical Association (Declaration of Helsinki) for human experiments.
Results
Standard Hindi was used for the translation of LSDQ-C, PCRQ-C, and CBQ-C. Results of the pilot study revealed no discrepancies in the terminology used in the Hindi versions of all the scales, and none of the participants reported any problem comprehending the items of any scale. Out of 300 eligible participants, 200 gave consent for their children to participate in the study and completed baseline assessment. The mean age of children was 13.9±1.6 years at baseline observation. Among participants, 42.5% were boys and 57.5% were girls, slightly more than half (55.0%) were high school students and 42.5% were middle-school students, and 5.5% had attained higher secondary level education.
Concordance between items and total scores of English and Hindi versions of all study measures (LSDQ-C, PCR-C, CBQ-C) was examined using Chronbach’s alpha. ICC and means were compared using the paired t-test. A significant difference between means in the English and Hindi version was observed only on two items (LSDQ-C item 19, p = 0.014 and CBQ-C item 9, p = 0.019). The rest had non-significant differences across all the measures. Item wise values are presented in Tables 1, 2, and 3.
ICC and Chronbach’s alpha scores of the Hindi version of LSDQ-C were 0.87 and 0.93, 0.93 and 0.96 for PCR-C, and 0.80 and 0.89 for CBQ-C, respectively. Item wise values are presented in Tables 1, 2, and 3.
Table 1: Item-wise description of English/ Hindi and baseline/retest values of Hindi version of Loneliness and Dissatisfaction Questionnaire.
|
Item 1 |
3.78 (0.96) |
3.81 (1.00) |
0.109 |
0.98 |
0.96 |
3.79 (1.07) |
3.78 (1.06) |
0.948 |
0.96 |
0.93 |
|
Item 2 |
2.02 (0.81) |
2.02 (0.80) |
0.319 |
0.99 |
0.97 |
1.99 (0.81) |
2.34 (2.17) |
0.279 |
0.82 |
0.80 |
|
Item 3 |
1.95 (0.83) |
1.90 (0.82) |
0.088 |
0.94 |
0.90 |
1.98 (0.90) |
1.90 (0.85) |
0.873 |
0.98 |
0.97 |
|
Item 4 |
3.90 (0.94) |
3.80 (0.94) |
0.565 |
0.96 |
0.92 |
3.90 (0.93) |
3.80 (0.95) |
0.605 |
0.97 |
0.95 |
|
Item 5 |
3.37 (0.95) |
3.47 (0.95) |
0.319 |
0.90 |
0.88 |
3.43 (0.88) |
3.61 (1.06) |
0.386 |
0.79 |
0.75 |
|
Item 6 |
3.80 (1.07) |
3.79 (1.08) |
0.083 |
0.97 |
0.94 |
3.76 (1.00) |
3.69 (1.02) |
0.477 |
0.98 |
0.96 |
|
Item 7 |
1.80 (1.80) |
1.79 (0.66) |
0.319 |
0.88 |
0.84 |
1.77 (0.70) |
1.85 (0.77) |
0.450 |
0.94 |
0.80 |
|
Item 8 |
3.84 (1.06) |
3.86 (1.07) |
0.481 |
0.99 |
0.98 |
3.77 (1.12) |
3.63 (1.12) |
0.384 |
0.97 |
0.95 |
|
Item 9 |
4.07 (0.82) |
4.08 (0.81) |
0.158 |
0.98 |
0.96 |
4.09 (0.77) |
4.03 (0.78) |
0.591 |
0.95 |
0.92 |
|
Item 10 |
3.73 (1.01) |
3.70 (1.01) |
0.319 |
0.92 |
0.88 |
3.69 (0.89) |
3.85 (0.95) |
0.327 |
0.91 |
0.84 |
|
Item 11 |
2.75 (1.15) |
2.72 (1.16) |
0.096 |
0.94 |
0.90 |
2.84 (1.11) |
2.85 (0.97) |
0.947 |
0.95 |
0.90 |
|
Item 12 |
3.37 (1.17) |
3.80 (1.17) |
0.063 |
0.80 |
0.76 |
3.39 (1.10) |
3.38 (1.13) |
0.950 |
0.97 |
0.94 |
|
Item 13 |
2.64 (0.97) |
2.66 (0.98) |
0.249 |
0.97 |
0.95 |
2.81 (1.05) |
2.82 (0.99) |
0.786 |
0.86 |
0.83 |
|
Item 14 |
2.01 (0.83) |
1.99 (0.83) |
0.706 |
0.96 |
0.94 |
2.07 (0.91) |
1.96 (0.81) |
0.336 |
0.89 |
0.81 |
|
Item 15 |
2.23 (1.09) |
2.26 (1.11) |
0.266 |
0.88 |
0.82 |
2.23 (1.12) |
2.35 (1.14) |
0.460 |
0.85 |
0.82 |
|
Item 16 |
3.41 (1.10) |
3.48 (1.13) |
0.304 |
0.96 |
0.90 |
3.30 (1.15) |
3.30 (0.98) |
0.515 |
0.91 |
0.84 |
|
Item 17 |
3.89 (1.06) |
3.93 (1.05) |
0.132 |
0.88 |
0.84 |
3.86 (1.10) |
3.69 (1.07) |
0.278 |
0.93 |
0.87 |
|
Item 18 |
2.27 (0.95) |
2.25 (0.94) |
0.481 |
0.97 |
0.94 |
2.34 (1.00) |
2.38 (0.90) |
0.770 |
0.90 |
0.82 |
|
Item 19 |
2.32 (1.09) |
2.31 (1.10) |
0.014 |
0.98 |
0.96 |
2.36 (1.15) |
2.47 (1.15) |
0.507 |
0.83 |
0.77 |
|
Item 20 |
3.94 (0.99) |
4.07 (0.98) |
0.259 |
0.84 |
0.80 |
3.78 (1.04) |
3.97 (0.97) |
0.189 |
0.88 |
0.80 |
|
Item 21 |
3.98 (1.00) |
4.09 (0.99) |
0.109 |
0.90 |
0.88 |
3.82 (1.01) |
4.00 (1.02) |
0.195 |
0.89 |
0.80 |
|
Item 22 |
3.68 (1.02) |
3.71 (1.00) |
0.258 |
0.98 |
0.96 |
3.42 (0.93) |
3.60 (1.05) |
0.208 |
0.88 |
0.82 |
|
Item 23 |
3.45 (1.21) |
3.47 (1.22) |
0.071 |
0.84 |
0.82 |
3.54 (1.04) |
3.47 (1.19) |
0.620 |
0.90 |
0.81 |
ICC: intraclass correlation.
Table 2: Item wise description of English/Hindi and baseline/retest values of Hindi version of the Parent-Child Relationship Scale.
|
Item 1 |
3.72 (1.26) |
3.73 (1.27) |
0.764 |
0.95 |
0.92 |
3.74 (1.30) |
3.70 (1.29) |
0.829 |
0.98 |
0.97 |
|
Item 2 |
3.29 (1.12) |
3.30 (1.11) |
0.407 |
0.98 |
0.97 |
3.43 (1.10) |
3.40 (1.11) |
0.750 |
0.87 |
0.98 |
|
Item 3 |
3.49 (1.31) |
3.52 (1.36) |
0.194 |
0.88 |
0.84 |
3.60 (1.33) |
3.55 (1.31) |
0.792 |
0.86 |
0.88 |
|
Item 4 |
3.69 (1.21) |
3.74 (1.23) |
0.129 |
0.96 |
0.92 |
3.75 (1.23) |
3.70 (1.23) |
0.777 |
0.97 |
0.98 |
|
Item 5 |
2.97 (1.28) |
2.96 (1.32) |
0.565 |
0.92 |
0.88 |
3.04 (1.41) |
3.02 (1.39) |
0.921 |
0.98 |
0.97 |
|
Item 6 |
3.51 (1.21) |
3.55 (1.24) |
0.145 |
0.97 |
0.94 |
3.64 (1.21) |
3.55 (1.19) |
0.601 |
0.96 |
0.98 |
|
Item 7 |
3.30 (1.06) |
3.32 (1.13) |
0.591 |
0.95 |
0.92 |
3.51 (1.11) |
3.44 (1.09) |
0.486 |
0.94 |
0.96 |
|
Item 8 |
3.43 (1.12) |
3.44 (1.19) |
0.858 |
0.96 |
0.93 |
3.49 (1.24) |
3.41 (1.19) |
0.647 |
0.92 |
0.96 |
|
Item 9 |
3.75 (1.22) |
3.75 (1.25) |
0.764 |
0.88 |
0.86 |
3.84 (1.21) |
3.75 (1.19) |
0.602 |
0.82 |
0.76 |
ICC: intraclass correlation.
Table 3: Item wise description of English/Hindi and baseline/retest values of Hindi version of Conflict Behavior Questionnaire.
|
Item 1 |
0.42 (0.34) |
0.43 (0.43) |
0.416 |
0.96 |
0.93 |
0.45 (0.50) |
0.47 (0.49) |
0.780 |
0.91 |
0.84 |
|
Item 2 |
0.78 (0.41) |
0.77 (0.41) |
0.319 |
0.97 |
0.94 |
0.81 (0.39) |
0.76 (0.42) |
0.393 |
0.92 |
0.85 |
|
Item 3 |
0.59 (0.49) |
0.57 (0.46) |
0.319 |
0.95 |
0.92 |
0.57 (0.49) |
0.56 (0.49) |
0.888 |
0.90 |
0.94 |
|
Item 4 |
0.45 (0.35) |
0.39 (0.37) |
0.533 |
0.74 |
0.72 |
0.14 (0.35) |
0.13 (0.34) |
0.842 |
0.87 |
0.88 |
|
Item 5 |
0.61 (0.48) |
0.58 (0.23) |
0.252 |
0.89 |
0.80 |
0.60 (0.49) |
0.57 (0.49) |
0.671 |
0.95 |
0.92 |
|
Item 6 |
0.47 (0.50) |
0.46 (0.22) |
0.083 |
0.98 |
0.96 |
0.52 (0.50) |
0.50 (0.51) |
0.889 |
0.93 |
0.98 |
|
Item 7 |
0.52 (0.36) |
0.56 (0.37) |
0.319 |
0.94 |
0.89 |
0.07 (0.27) |
0.49 (0.21) |
0.392 |
0.80 |
0.86 |
|
Item 8 |
0.80 (0.40) |
0.79 (0.40) |
0.158 |
0.98 |
0.97 |
0.92 (0.27) |
0.91 (0.25) |
0.981 |
0.72 |
0.84 |
|
Item 9 |
0.61 (0.48) |
0.57 (0.49) |
0.019 |
0.95 |
0.90 |
0.60 (0.49) |
0.59 (0.49) |
0.887 |
0.98 |
0.99 |
|
Item 10 |
0.16 (0.36) |
0.18 (0.38) |
0.207 |
0.90 |
0.82 |
0.06 (0.25) |
0.07 (0.27) |
0.790 |
0.78 |
0.87 |
|
Item 11 |
0.48 (0.42) |
0.43 (0.42) |
0.103 |
0.96 |
0.94 |
0.52(0.50) |
0.54 (0.50) |
0.780 |
0.92 |
0.95 |
|
Item 12 |
0.40 (0.39) |
0.43 (0.41) |
0.740 |
0.95 |
0.90 |
0.43 (0.49) |
0.47 (0.49) |
0.888 |
0.88 |
0.82 |
|
Item 13 |
0.65 (0.43) |
0.68 (0.46) |
0.083 |
0.98 |
0.97 |
0.47 (0.50) |
0.48 (0.50) |
0.889 |
0.92 |
0.90 |
|
Item 14 |
0.69 (0.46) |
0.66 (0.33) |
0.158 |
0.96 |
0.94 |
0.73 (0.44) |
0.74 (0.43) |
0.874 |
0.97 |
0.98 |
|
Item 15 |
0.47 (0.50) |
0.42 (0.33) |
0.319 |
0.92 |
0.88 |
0.40 (0.49) |
0.39 (0.26) |
0.991 |
0.89 |
0.87 |
|
Item 16 |
0.43 (0.34) |
0.42 (0.38) |
0.083 |
0.96 |
0.94 |
0.06 (0.25) |
0.05 (0.23) |
0.776 |
0.75 |
0.86 |
|
Item 17 |
0.44 (0.41) |
0.47 (0.42) |
0.158 |
0.95 |
0.91 |
0.47 (0.50) |
0.49 (0.50) |
0.781 |
0.96 |
0.98 |
|
Item 18 |
0.67 (0.40) |
0.66 (0.47) |
0.656 |
0.97 |
0.95 |
0.40 (0.49) |
0.41 (0.49) |
0.887 |
0.98 |
0.99 |
|
Item 19 |
0.67 (0.47) |
0.64 (0.43) |
0.706 |
0.95 |
0.92 |
0.69 (0.46) |
0.68 (0.46) |
0.880 |
0.93 |
0.96 |
ICC: intraclass correlation.
Face validity is subjective assessment and opinion and feedback are sought by experts and representative of the targeted population. Experts assess the reliability, clarity of the language used, and comprehensive compatibility of items. As per Terwee et al,29 there are no standards for the measurement of face validity. The face and content validity of the English and Hindi versions of LSDQ-C, PCRQ-C, and CBQ-C was judged by six professionals and 12 children of either gender from the targeted population. None of the children had difficulty understanding any of the items. Four out of six experts communicated the face validity of these scales, and two experts suggested a few modifications by reframing a few Items. Changes were done as per the expert’s advice.
Internal consistency of the clinical measures was assessed for the child versions of LSDQ-C, PCRQ-C, and CBQ-C in terms of Cronbach’s alpha. Cronbach’s alpha was estimated for internal consistency, and an alpha value > 0.70 was considered sufficient. Chronbach’s alpha values for the full scale were 0.96 for LSDQ-C, 0.91 for PCRQ-C, and 0.94 for CBQ-P.
For test-retest reliability, scales were administered on a minimum of 50% of the population after a one-week gap and ICC was computed for both observations. Despite giving consent for both observations, only 102 children responded on the second observation (retesting). For test-retest reliability, baseline scores were compared with scores on the same measure using the paired t-test. The ICC for LSDQ-C was 0.87, for PCR-C was 0.93, and for CBQ-C was 0.97. Item wise description is presented in Tables 1, 2, and 3.
Split-half reliability of LSDQ-C, PCRQ-C, and CBQ-C was assessed using split half coefficients (Spearman-Brown and Guttman’s) and obtained coefficient for all three scales was ≥ 0.80. Split-half reliability for LSDQ-C [α value: first half = 0.84 (item 1–12); second half = 0.79 (item 13–24)], PCRQ-C [α value: first half = 0.84 (item 1–5); second half = 0.71 (item 6–10)] and CBQ-C [α value: first half = 0.74 (item 1–10); second half = 0.77 (item 11–20)].
The Bland Altman plot for LSDQ-C, PCR-C and CBQ-C shown in Figure 2. A scatter plot was created for total baseline and total retest scores for all scales and has been plotted against the difference of two sets of scores. The continuous green line is of mean difference, the dotted red lines represent 95% limits of agreement with ± 1.9 standard deviations. On X and Y axes scores are represented in percentages.
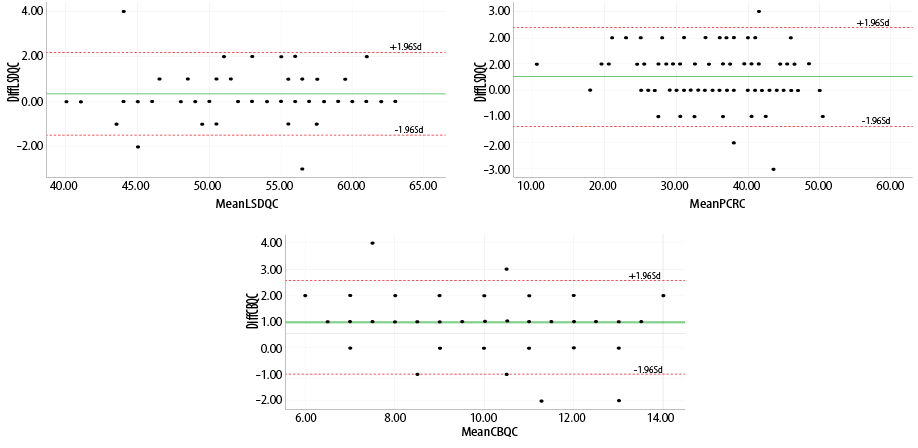
Figure 2: Test retest reliability of LSDQ-C,PCR-C, and CBQ-C, shown by Bland Attman plot.
All participants completed the three scales with their demographic information. A panel of six experts assessed face and content validity. Internal consistency was assessed using intraclass correlation (ICC), test-retest, and split-half reliability. To determine the test-retest reliability, Google forms were sent to all the participants five to seven days after completing the baseline observation; 102 responded for the second observation. A one-week gap was given to minimize the recall effect and to avoid the impact of any life event on the participant’s response to the questionnaires.
Discussion
We attempted to translate, adapt, and examine the psychometric properties of three questionnaires (used to determine loneliness, relationship, and behavior in children) into a Hindi translation, and cross language concordance was done by following a well-established methodology by the World Health Organization.24 A Hindi version of these scales would give native people of India a chance to comprehend and respond in a better way and will make research more effective and comparable with findings using these scales across the globe. Psychometric properties of adapted versions of all three scales confirm that the content of items of these scales have not changed in the translation process and the scales were easy to understand for the targeted population.
Concordance between items and total scores of English and Hindi versions of all study measures was examined using ICC and Chronbach’s alpha. The ICC for English and Hindi version was > 0.87 for all the scales. Item wise test-retest reliability of Hindi version of all the scales was assessed and on most of the items, the ICC value was > 0.80, indicting good to excellent reliability. ICC value was in the acceptable range for a few items for both child and parent versions of the scales (0.70). The above findings suggest good to excellent agreement between the English and Hindi version of all scales.
As per Anderson’s criteria for evaluating psychometric properties of psychological tools, Cronbach’s alpha ≥ 0.80 expresses excellent reliability. Internal consistency in our study was assessed using Cronbach’s alpha for all the scales. Cronbach’s alpha for total scores was ≥ 0.89 to 0.96, and item-wise ranges from 0.80 to 0.99. These findings are suggestive that the Hindi version of all the scales has high internal consistency. Similar results have been reported in the literature: LSDQ,13,14,30 PCRQ,8,16 and CBQ.21
Chronbach’s alpha for LSDQ was 0.93 for total scores and item-wise ranged from 0.79 to 0.96. Our findings are in line with previous studies that reported Chronbach’s alpha scores of 0.85 and 0.75.16,31 Chronbach’s alpha value in our study for PCRQ ranged from 0.82 to 0.98 and for total score it was 0.91. Xu et al,19 in the Chinese version of PCRQ found internal consistency ranged between 0.68 to 0.88. In our study, for CBQ the Chronbach’s alpha value ranged from 0.72 to 0.98, and for full scale, it was 0.94. These findings are similar to findings of a previous study, where the internal consistency of the Urdu version ranged between 0.73 to 0.89,22 and for English version it was reported as 0.88.21
Overall, our findings suggest that the three scales provide adequate psychometric properties in cross-cultural language concordance, internal consistency, and test-retest reliability. Thus, we can conclude that the findings our study suggest that the Hindi translation of LSDQ-C, PCRQ-C, and CBQ-C have good psychometric properties in terms of cross-cultural language concordance, internal consistency, and test-retest reliability. The study laid out adequate evidence to facilitate the use of these scales in Hindi speaking populations.
Conclusion
Our study suggests that the Hindi version of LSDQ-C, PCRQ-C, CBQ-C, and cross-language has equivalence with the English version. The internal consistency, split-half reliability, and test-retest reliability are good to excellent. Thus, the Hindi version of LSDQ-C, PCRQ-C, and CBQ-C as translated in this study is a valid instrument. It is hoped that the availability of these instruments will help the researchers study the association of these variables with religiosity.
Disclosure
The authors declared no conflicts of interest. No funding was received for this study.
Acknowledgements
The authors express gratitude to all the participants for their valuable time and cooperation. We would like to extend our gratitude to Sh. Rubinderjit Singh Brar, Director Education, Chandigarh Administration, Prof. Dalip Rusa, Mrs. Manjit Kaur, Mr. Arjun, Ms. Nidhi, (Education Department), and Principals of schools and teachers for their kind concern
and help.
references
- 1. Lempinen L, Junttila N, Sourander A. Loneliness and friendships among eight-year-old children: time-trends over a 24-year period. J Child Psychol Psychiatry2018 Feb;59(2):171-179.
- 2. Asher SR, Hymel S, Renshaw PD. Loneliness in children. Child Dev1984;55:1456-1464.
- 3. Maes M, Van den Noortgate W, Vanhalst J, Beyers W, Goossens L. The children’s loneliness scale: factor structure and construct validity in Belgian children. Assessment 2017 Mar;24(2):244-251.
- 4. Goossens L, Beyers W. Comparing measures of childhood loneliness: internal consistency and confirmatory factor analysis. J Clin Child Adolesc Psychol2002 Jun;31(2):252-262.
- 5. Yeh KH. Mediating effects of negative emotions in parent–child conflict on adolescent problem behavior. Asian J SocPsychol2011;14(4):236-245.
- 6. Bradford K, Vaughn LT, Barber BK. When there is conflict interparental conflict, parent–child conflict, and youth problem behaviors. J Fam Issues2008;29(6):780-805.
- 7. Escalante-Barrios EL, Suarez-Enciso SM, Raikes H, Davis D, Garcia A, Gonen M, et al. Child-parent interactions in American and Turkish families: examining measurement invariance analysis of child-parent relationship scale. PLoS One2020 Apr;15(4):e0230831.
- 8. Gerdes AC, Hoza B, Pelham WE. Attention-deficit/hyperactivity disordered boys’ relationships with their mothers and fathers: child, mother, and father perceptions. Dev Psychopathol2003;15(2):363-382.
- 9. Hay FB. The psychometric properties of the parent-child relationship questionnaire (Doctoral dissertation, University of East Anglia); 2000.
- 10. Findlay LC, Coplan RJ, Bowker A. Keeping it all inside: shyness, internalizing coping strategies, and socio-emotional adjustment in middle childhood. Int J Behav Dev2009;33(1):47-54.
- 11. Robin AL, Foster SL. Negotiating parent–adolescent conflict: a behavioral–family systems approach. Guilford Press; 1989.
- 12. Kingery JN, Erdley CA. Peer experiences as predictors of adjustment across the middle school transition. Educ Treat Child2007:73-88.
- 13. Galanaki EP, Azizi AK. Loneliness and social dissatisfaction. Child Study J1999;29(1):1-22.
- 14. Coplan RJ, Closson LM, Arbeau KA. Gender differences in the behavioral associates of loneliness and social dissatisfaction in kindergarten. J Child Psychol Psychiatry2007 Oct;48(10):988-995.
- 15. Bagner DM, Storch EA, Roberti JW. A factor analytic study of the loneliness and social dissatisfaction scale in a sample of African-American and Hispanic-American children. Child Psychiatry Hum Dev2004;34(3):237-250.
- 16. Xu N. The association between parent-child relationship and child loneliness; 2017.
- 17. Furman W, Giberson S. Identifying the links between parents and their children’s sibling relationships. In: Shulman S, editor. Close relationships in social-emotional development; 1995. p. 95-108.
- 18. Miller-Clayton AK. Effects of sexual abuse and cultural coping on African American parent-child relationships: implications for intervention; 2010.
- 19. Xu C .Direct and indirect effects of parenting style with child temperament, parent-child relationship, and family functioning on child social competence in the Chinese culture: testing the latent models. University of North Texas; 2007.
- 20. Siu FY. Internalizing problems among primary school children in Hong Kong: prevalence and treatment. ProQuest; 2006.
- 21. Prinz RJ, Foster S, Kent RN, O’Leary KD. Multivariate assessment of conflict in distressed and non distressed mother-adolescent dyads. J Appl Behav Anal1979;12(4):691-700.
- 22. Khan NR, Malik JA, Kamal A. Discrepancies in parents-adolescents conflicts across gender: a step forward in validation of conflict behavior questionnaire-44; 2015.
- 23. Tripathi P, Mukherjee P, Hendre M, Godse M, Chakraborty B. Word sense disambiguation in Hindi language using score based modified lesk algorithm. International Journal of Computing and Digital Systems2020;10:2-20.
- 24. World Health Organization. Process of translation and adaptation of instruments. [cited 2009 November 30]. Available from: http://www.who.int/substance_abuse/research_tools/translation/en.
- 25. Gerdes AC, Hoza B, Arnold LE, Hinshaw SP, Wells KC, Hechtman L, et al. Child and parent predictors of perceptions of parent–child relationship quality. J Atten Disord2007 Jul;11(1):37-48.
- 26. Hinkin TR, Tracey JB, Enz CA. Scale construction: developing reliable and valid measurement instruments. J Hosp Tour Res (Wash DC)1997;21(1):100-120.
- 27. Nunnally JC, Bernstein I. Psychometric theory. 3rd ed. New York: McGraw-Hill; 1994.
- 28. Turner SP. The concept of face validity. Qual Quant1979 Feb;13(1):85-90.
- 29. De Vet HC, Terwee CB, Mokkink LB, Knol DL. Measurement in medicine: a practical guide. Cambridge University Press; 2011.
- 30. Chen X, He Y, De Oliveira AM, Coco AL, Zappulla C, Kaspar V, et al. Loneliness and social adaptation in Brazilian, Canadian, Chinese and Italian children: a multi-national comparative study.J Child Psychol Psychiatry2004 Nov;45(8):1373-1384.
- 31. Galanaki E P, Azizi AK. Loneliness and social dissatisfaction. Child Study Journal 1999;29(1):1-22.