|
Abstract
Objectives: To investigate whether younger patients with type 2 diabetes mellitus have higher glycated hemoglobin A1c (HbA1c) levels compared to older patients, and to determine the factors associated with higher HbA1c levels.
Methods: Data from 1,266 patients from all over Oman were used to obtain the mean HbA1c level, odds ratios (OR), and 95% confidence intervals (CI) from multiple logistic regression models with age groups, sex, duration of diabetes, diabetes treatment, body mass index, estimated glomerular filtration rate (eGFR), tobacco use, and healthcare index as predictors of good (HbA1c <7%) vs.poor (≥7%) glycemic control.
Results: Mean HbA1c levels were 8.9, 8.3, and 7.8 in the age groups 20-39, 40-59 and 60+ years, respectively. After controlling for all other covariates, the OR of good glycemic control increased with age, 40-59 years old (OR=1.7; 95% CI 1.1 to 2.6) and 60+ year (OR=2.5; 95% CI 1.6 to 4.0), female gender (OR=1.5; 95% CI 1.2 to 2.0) and in patients with eGFR ≥60 mL/min/1.73 m2 (OR=1.9; 95% CI 1.1 to 3.3). Longer duration of diabetes (≥5years) and treatment with oral agents or insulin were inversely related to good glycemic control.
Conclusion: Younger Omani adults exhibit worse glycemic levels compared to older adults posing a formidable challenge to diabetes care teams.
Keywords: Diabetes; Oman; HbA1c; Epidemiology.
Introduction
The burden of type 2 diabetes mellitus (T2DM) is on the increase worldwide, affecting more than 8% of the global adult population.1 Projections for the year 2030 estimate T2DM to affect nearly 10% of the world's population. In Oman, three epidemiological surveys have shown diabetes prevalence to have increased from 9.6% in 1991 to 11.6% in 2000 and 12.3% in 2008.2-4 Currently, there are over 60,000 patients registered on the National Diabetes Register in Oman, with ~5000 new cases being diagnosed each year.5 Most of the increase in the number of registered cases between 2000-2009 in Oman is observed in the 40-59 years compared to 20-39 or 60+ years.5 A similar trend is seen globally where the greatest number of people with diabetes are between 40 to 59 years of age.1
The risk of diabetic complications in patients with T2DM is strongly associated with the level of glycemia. Tighter glycemic control is shown to reduce the risk of microvascular and perhaps macrovascular complications of diabetes.6 Glycated hemoglobin A1c (HbA1c) has been used by clinicians as the gold standard to measure patients’ glycemic control over the previous 2-3 months.7 It enables them to make treatment decisions to achieve favorable diabetes control with the aim of reducing or avoiding complications associated with hyperglycemia. However, some studies have suggested that younger people have higher levels of HbA1c compared to older adults with diabetes.8,9 This cross-sectional study investigates whether younger Omanis with T2DM exhibit higher levels of HbA1c in a nationally representative sample, and if so, determine whether this is independent of age, sex, type of treatment, duration of diabetes, body mass index (BMI), glomerular filtration rate, tobacco use, and healthcare index.
Methods
The sample for this study was a subset of a database collected to determine the level of diabetes control and cardiometabolic risk factors in Omani patients with T2DM in 2007. A two stage cluster sampling technique was employed in which primary healthcare (PHC) facilities were considered as clusters-primary sampling units (PSU). PHC centres with less than 20 registered diabetic patients were excluded and clusters were classified into strata based on number of registered diabetic patients (denoting size of each cluster). Subsequently, 16 clusters were chosen from a total of 126 eligible clusters from 8 strata. All patients in the selected cluster were included in the study (n=2,551). In this subset, patients aged 20 years and above being followed up in PHC centres and with non-missing data for all variables used in this analysis were selected (n=1,266).
Data collection was limited to the period from January to December 2007. Diabetes registers (represented by hardcopy records which trace summary of patients’ clinical parameters at initial diagnosis and each subsequent annual visit) and computer frameworks, where available, were used to complement data collected from patients’ case notes. Data were collected mainly by the clinic nurse and supervised by the physician conducting the local diabetes clinic. The data collection phase was completed by 2008. Ethical approval was obtained from the National Research and Ethical Committee at the Ministry of Health.
Collected variables included patients’ age, sex, height, weight, tobacco use, medication intake, duration of diabetes, results of urinary dipsticks for protein, and albumin-to-creatinine ratio, (Table 1). Further, data on the frequency of visits, blood pressure, and weight measurements per patient per year were also collected. Fundus eye examination with or without pupillary dilatation, existence of lipid profile, and existence of an electrocardiogram (ECG) were also noted.
Age was categorized into three groups (20-39) vs. (40-59, and 60 years or above). Body mass index (calculated as weight in kilograms divided by the square of height in meters [Kg/m2]) was categorized as normal (BMI <25 Kg/m2) vs. overweight (BMI 25≤30 Kg/m2) and obese (BMI ≥30 Kg/m2). Diabetes was diagnosed as recommended by the American Diabetes Association’s Guidelines.10 Duration of diabetes was categorized as <5 vs. ≥5 years. Treatment types were recorded as diet control (no medication intake) vs. oral agents, insulin, or insulin with oral agents. The last two categories were combined for the purpose of analysis. HbA1c was measured in hospital nearest to the primary healthcare centres using Hitachi 911, 912, or 902 automated chemistry analyzer (Boehringer Mannheim) in 95% of selected centres and Synchron CX5 biochemistry analyzer (Beckman Coulter) in 5% of centres. Both machines were used as per the instructions and proprietary reagents supplied by the manufacturers. No attempt was made to standardize any of the machines used in such measurements. Estimated glomerular filtration rate (eGFR) was calculated using the Modification of Diet in Renal Disease (MDRD) study equation,11 and this was coded as <60 vs. ≥60 mL/min/1.73m2. Tobacco use was dichotomized into (nonsmoker/nonuser) vs. users (defined as those who smoked or used tobacco during the year of the study in 2007).
Healthcare index (HCI) was constructed using frequencies of outpatient visits, weight, and blood pressure measurements within the year of the study (all three categorized in relation to the median for the three variables [<6 vs. ≥6 per patient per year]). In addition, 4 selected outpatient department procedures were included in HCI such as annual fundus examination with pupillary dilatation vs. without dilatation and coded as (yes/no); measurement of proteinuria in urine by dipstick strips (negative/positive) or urine albumin-to-creatinine ratio (ACR) ≥2.5 mg/mmol for men and ≥3.5 mg/mmol for women vs. complement of the two cut-points (coded as yes/no).12 Lipid profile measurements and availability of electrocardiogram was coded as (done/not done). Each of the HCI components was given equal score of 1 if the OPD procedure was done or frequency of OPD procedures was ≥ median of 6, and 0 if not done or if the measurement was below the median. The total HCI score for each subject was calculated as the sum of individual scores which thus varied from 0 to 7. The latest HbA1c level, plus two earlier readings if available within 2007, were recorded. The average of the three readings was dichotomized as good (<7%) vs. poor (≥7%) glycemic control (coded as 1 and 0, respectively) and used as dependent variable in the analysis.
Table 1: Selected demographic, clinical, and out-patient procedures of 1,266 patients with type 2 diabetes mellitus, Oman, 2007.
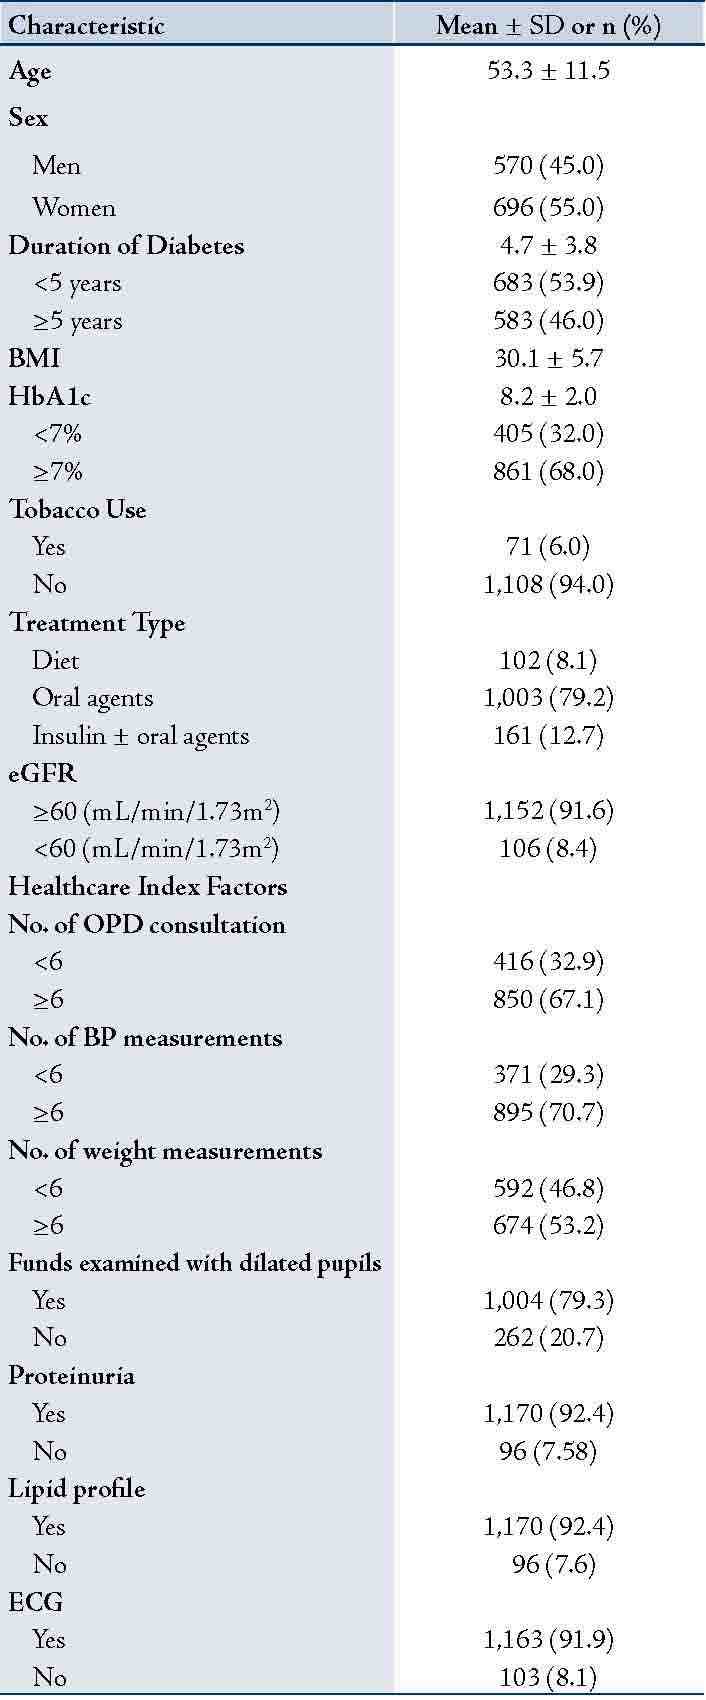
Data presented as mean± SD or n (%); Glycated hemoglobin (HbA1c); body mass index (BMI); Estimated glomerular filtration rate (eGFR).
As for statistical analysis, data were entered in EPINFO (version 6, CDC, Atlanta, GA). Means of HbA1c for each age group vs. other covariate is presented using the “table” command in Stata (version 11, Stata Corporation, TX, USA). Nonparametric trend test for ordered groups was used to test for significance of trends in the means of HbA1c in each age stratum and selected covariate. ANOVA was used to assess group difference. Backward stepwise logistic regression analysis with HbA1c as dependent variable was used to obtain odds ratio (OR) and 95% confidence intervals (CI) for factors which may influence HbA1c level. Covariates were entered in the full model (age groups, sex, duration of diabetes, diabetes treatment, BMI, eGFR, tobacco use, and HCI). To obtain a final model, independent variables were excluded from the model, one at a time, based on their statistical significance in the model. The model’s goodness-of-fit (which assesses whether the observed and expected frequencies match) was tested using Hosmer-Lemeshow's test. A value of p<0.05 was considered statistically significant.
Results
Of the total 1,266 individuals, 696 (55%) were women. The mean ±(SD) of patients' age was 53.3±(11.5), the mean duration of diabetes was 4.7±(3.8) and the mean BMI was 30.1±(5.7), (Table 1). The overall mean HbA1c was 8.2±(2.0). Thirty-two percent of patients had HbA1c levels within the American Diabetes Association recommendations for good glycemic control (<7%). The majority of patients were on oral hypoglycemic agents (79%) and had eGFR of ≥60 mL/min/1.73m2 (91%). Diabetes healthcare factors ranged from 53% for taking weight measurements to 82% for testing proteinuria, lipid profile, and obtaining an ECG.
The youngest adults had significantly higher mean HbA1c (p=0.001), (Table 2). There was a statistically significant difference in the mean HbA1c between the three age groups in subjects with ≥5 years of diabetes, on oral hypoglycemic agents, and with BMI in the range of overweight or obesity. A similar relation was seen in subjects with HCI score of 5-7, with eGFR ≥60 mL/min/1.73m2 and those who did not use tobacco (in all p=0.001). Patients with normal BMI, treated with diet or insulin and with HCI score of <5 did not show significant trend in the mean HbA1c towards younger age groups (p>0.05).
Table 2: Mean HbA1c levels by age and covariates among 1,266 patients with type 2 diabetes mellitus, Oman, 2007.
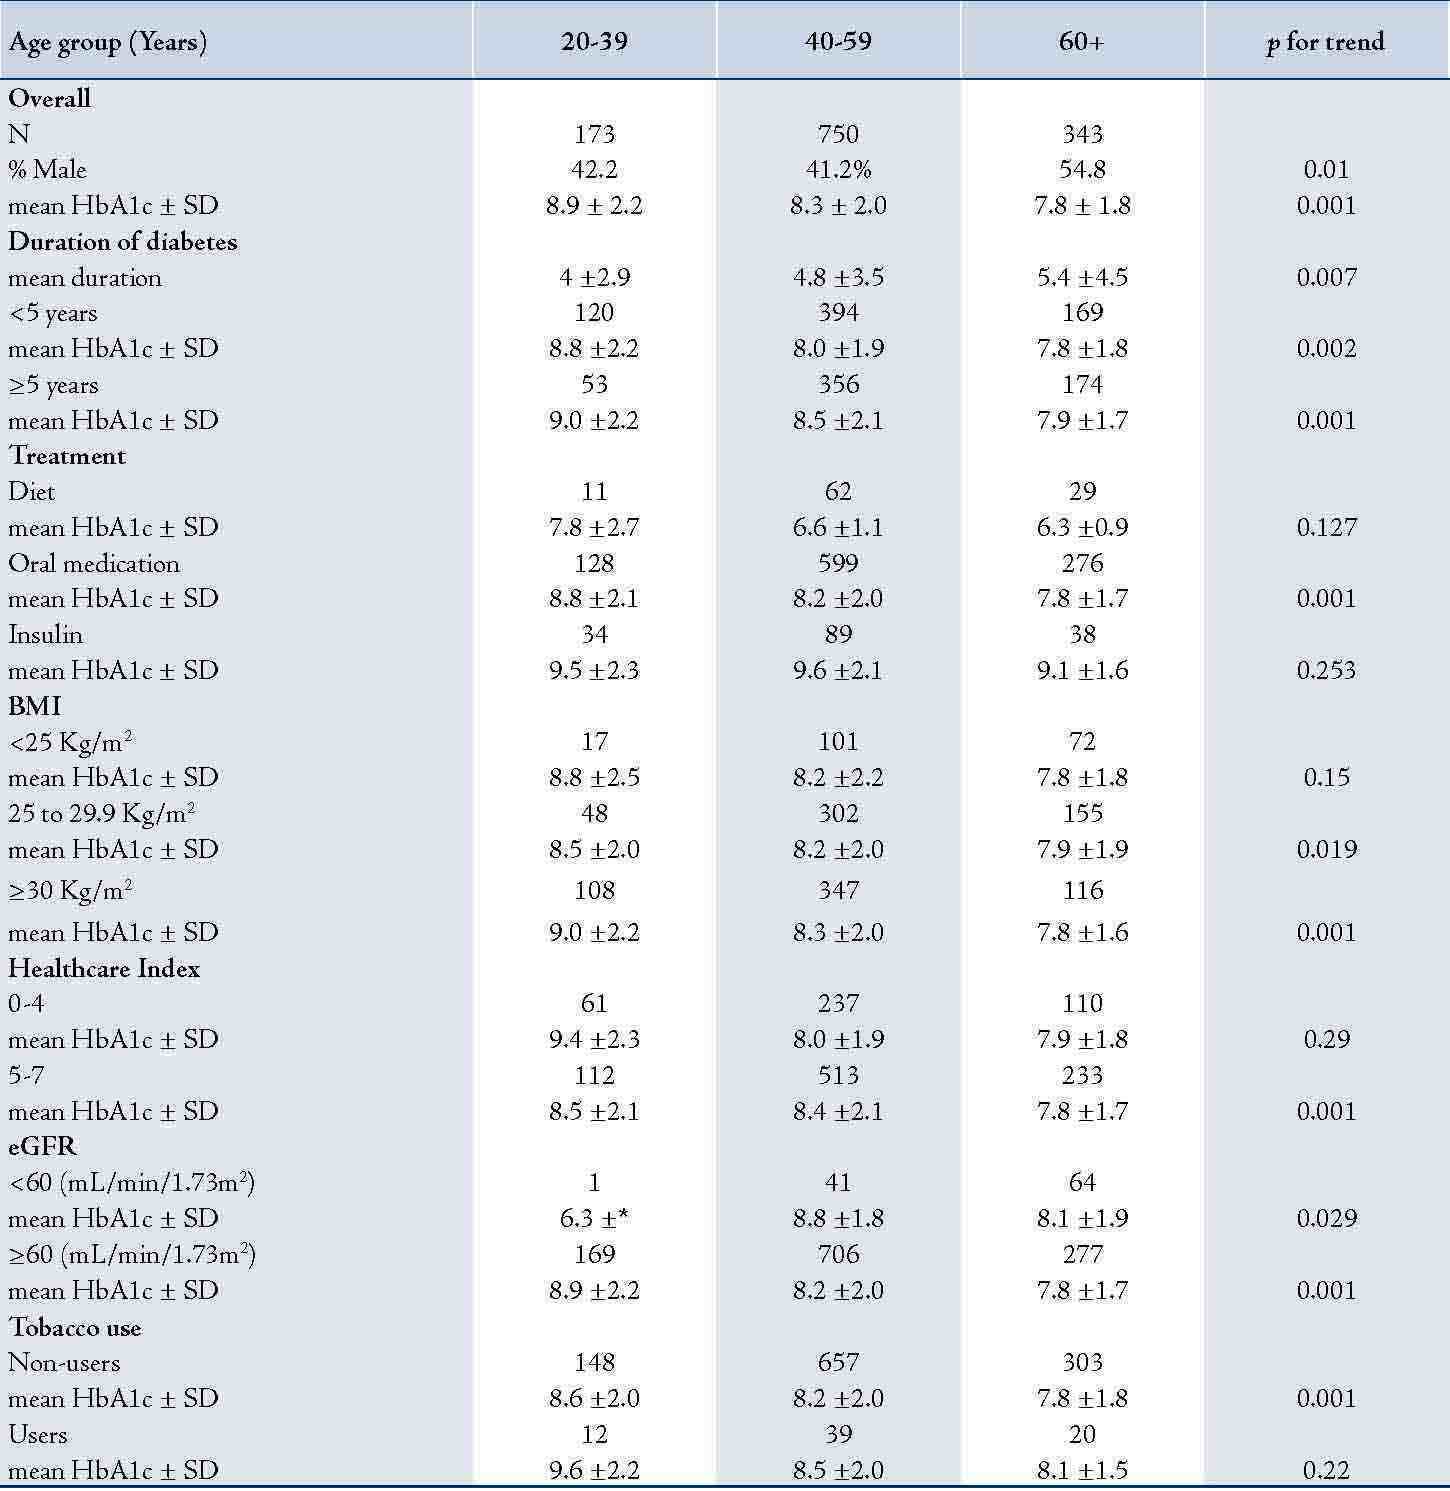
Numbers represent individuals in each category and their means± standard deviation (±SD); BMI: body mass index; eGFR: estimated glomerular filtration rate.
Obesity and overweight were more prevalent among patients aged 40-59 years compared to patients aged <40 or ≥60 years (p<001; data not shown). An inverse relation between mean HbA1c and each age group (20-39, 40-59 and ≥60 years) regardless of the duration of diabetes was observed. Overall, individuals with ≥5 years of diabetes had higher mean HbA1c levels compared to those who had diabetes for <5 years.
Both the full and the final multivariate logistic regression models with HbA1c as dependent variable and odds ratio for each covariates are shown in Table 3. In the full model (all covariates included), the odds ratio of good glycemic control was significantly increased with increasing age group, female gender and eGFR ≥60 ml/min/1.73m2. Conversely, the odds ratio of good glycemic control reduced with increasing duration of diabetes (OR=0.8; 95% CI 0.6 to 0.9), overweight (OR=0.9; 95% CI 0.6 to 1.3) and obesity (OR=0.8; 95% CI 0.6 to 1.2). Interactions terms for age and sex, sex and tobacco use and sex and treatment type were examined in the initial model but none were found significant and thus were excluded from the final model.
The final model (included only statistically significant variables) to predict HbA1c consisted of age, sex, duration of diabetes, treatment type and eGFR. After controlling for all other covariates, the odds ratio of good glycemic control was increased with increasing age; in 40 59 years old (OR=1.7; 95% CI 1.1 to 2.6) and 60+ years (OR 2.5; 95% CI 1.6 to 4.0) compared to 20-39 years (OR=1, reference category). Similarly, the odds ratio of good glycemic control was increased in women (OR=1.5, 95% CI 1.2 to 2.0) compared to men (OR=1; reference group) and in patients with eGFR ≥60 (OR=1.9; 95% CI 1.1 to 3.3) compared to those with eGFR <60 mL/min/1.73m2. On the other hand, the odds ratio for patients with longer duration of diabetes (≥5 years) and those on oral agents or on insulin treatment was inversely related to good glycemic control compared to patients with shorter duration of diabetes or on diet respectively, (Table 3). The final model’s Hosmer-Lemeshow’s goodness-of-fit p-value was 0.378, indicating good fit of the model.
Table 3: Odds ratios of good glycaemic control in multivariate logistic regression used to predict HbA1c (dependent variable) in 1,266 individuals with type 2 diabetes mellitus (adjusting for all shown independent variables) Oman, 2007.
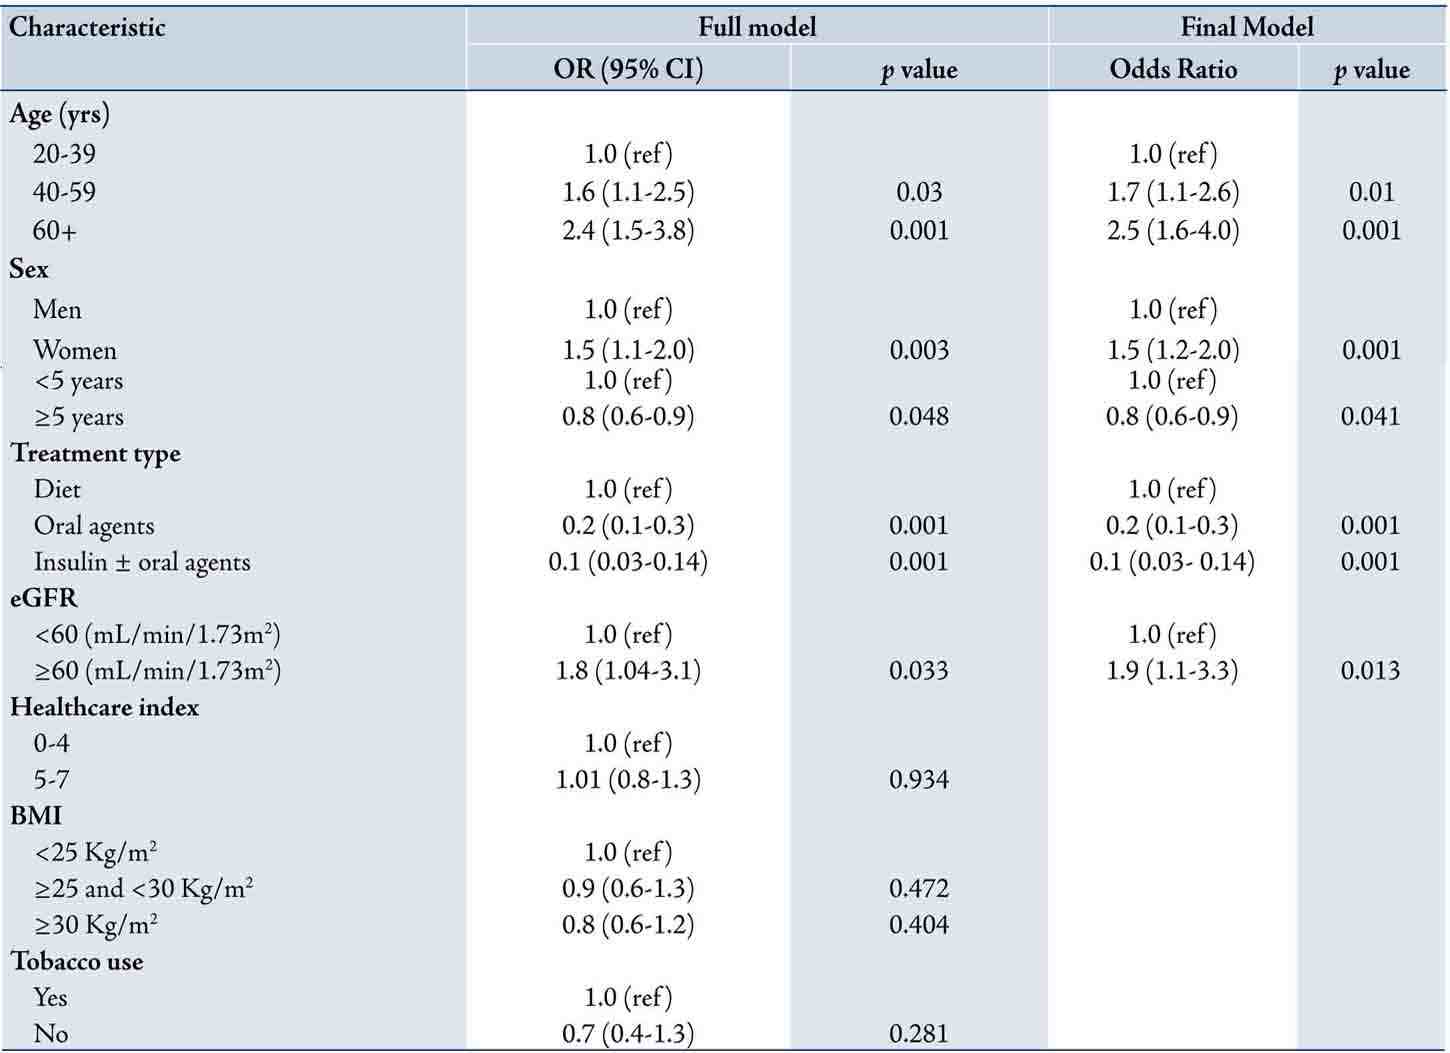
*SD could not be determined due to small number in this cell.
Discussion
This study showed an inverse relationship of good glycemic control with age among Omanis with T2DM after adjusting for gender, duration of diabetes, treatment type, eGFR, healthcare index, BMI, and tobacco use. Other studies reported a similar relationship between HbA1c and age,13 which persisted even after 5 to 12 months follow-up.8 Gilliland et al.13 proposed that this could be due to either “cohort effect” where various age groups represent different birth cohorts and same differences would continue as cohorts age. Alternatively, it could be due to “developmental effect” where cohorts mature and their glycemic control improves as they age. The former concept is favored as HbA1c deteriorates with time, (Fig. 1). However, follow-up studies are more likely to clarify this effect than cross-sectional studies like the current one.
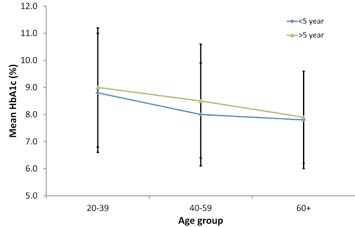
Figure 1: Mean HbA1c levels by age groups and duration of diabetes. Error bars represent standard deviation (±SD).
Higher levels of HbA1c in young people may also be related to rapid changes in lifestyles witnessed in Oman over the past four decades. Urbanization for example, has increased from 11% in 1970 to 80% in 2005, with a rapidly growing number of Omanis leaving arable land and labor-intensive jobs to work in less strenuous office-based or industrial jobs.14 Changing trends in urbanization and employment inevitably lead to changes in lifestyle that expose people, including those with diabetes to increased biological and behavioral risk factors. In addition, data on food imports to Oman indicate an increasing trend of per capita consumption of refined sugar, dried and evaporated whole milk, chicken, cheese, and chocolate products over the past decade, while fruit consumption has increased only slightly.15 High saturated fat intake is positively correlated with higher HbA1c.16
Access to healthcare and medications is likely to influence diabetes care and the related morbidity and mortality. Poor people with diabetes tend to have less access to blood glucose tests, insulin injections and more likely to have poorer levels of HbA1c.17 However, such factors are unlikely to play any significant role in Oman as healthcare provision is universally free for Omanis including the dispensing of all types of medication for all chronic conditions. It also seems unlikely that younger people with diabetes in Oman miss their outpatient visit appointments compared to older adults as the mean number of outpatient consultations by all age groups was similar in this study (ANOVA, p=0.66, data not shown).
In this study, although progression in BMI from normal to overweight and obesity were associated with worsening glycemic control, higher BMI could not independently account for poor HbA1c levels in patients with T2DM (p=0.934). In previous studies of people with diabetes in Oman, BMI was also shown not to be independently associated with the risk of diabetes mellitus once waist circumference was taken into account.18 Despite high prevalence of overweight (27%), obesity (24%), and metabolic syndrome (21%) in Oman,3,19 it is unclear whether these are related to higher HbA1c levels among younger age groups. This study lacked data on waist circumference to assess its relation to age and HbA1c.
Healthcare index was used to examine whether the provision of <5 or ≥5 routine services to people with diabetes is related to HbA1c levels. Providing ≥5 outpatient services did not result in significant changes in the odds ratio of having good glycemic control after controlling for other confounders. This may be due to the fact that the used factors, despite being part of standard diabetes care, may not be biologically relevant to the control of glycemia per se. Another study, having used foot and eye examination, diet and exercise instructions, general diabetes education, and influenza vaccine to compose HCI, showed that worsening HCI did not account for higher HbA1c.13
There were a few limitations in this study. First, patients who had no missing data on all variables used in this analysis were selected which may have introduced selection bias to the study and thus limiting comparability by age groups; however, comparing the study results on well-controlled patients with HbA1c <7% (32%; n=1266) with the full dataset (30%; n=2551), no significant difference (p=0.207) was shown. Second, although several factors that may influence HbA1c levels were studied, there remains a wide array of other factors which interplay to control HbA1c. Such factors include patient education,20 physical activity index,21 instruction dietician/educator,22 and various genetically inherited hemoglobinopathies,23 which were not available in this study. Nonetheless, the consistency of the results presented with other studies and being the first study to explore the relation of HbA1c with age among Arabs of the Middle East lends strength to this study.
Conclusion
The finding of this study of less favorable glycaemic control among young Omani patients with T2DM implies that diabetes control in younger adults is a formidable challenge to the healthcare system, diabetes care team, and the patient. It highlights the need for further research to understand other determinants of poor glycaemic control in the young and interventions to rectify it in Oman. Unless this is done, diabetes and its complications are expected to result in high morbidity and mortality over the next decade in Oman especially among younger adults.
Acknowledgements
We would like to thank all physicians and nurses from Regional Referral Hospitals in Oman who participated in the data collection process. We are also grateful to Mr. Salah Al-Harbi and Mrs Jokah Al-Rashidi who participated in data entry of this study.
References
1. International Diabetes Federation. IDF Diabetes Atlas, 5th edition. 2011 [cited. Available from: http://www.idf.org/diabetesatlas/5e/the-global-burden (Accessed: November 2011).
2. Asfour MG, Samantray SK, Dua A, King H. Diabetes mellitus in the sultanate of Oman. Diabet Med. 1991; 8(1): 76-80.
3. Al-Lawati JA, Al Riyami AM, Mohammed AJ, Jousilahti P. Increasing prevalence of diabetes mellitus in Oman. Diabet Med. 2002; 19(11): 954-957.
4. Ministry of Health. World Health Survey 2008. Available from Department of Research, Directorate General of Planning, Ministry of Health, Oman. 2011.
5. Directorate General of Planning. Annual health reports. Muscat: Ministry of Health, Oman; 2000-2009.
6. Stratton IM, Adler AI, Neil HA, Matthews DR, Manley SE, Cull CA, et al. Association of glycaemia with macrovascular and microvascular complications of type 2 diabetes (UKPDS 35): prospective observational study. BMJ. 2000; 321(7258): 405-412.
7. Consensus statement on the worldwide standardisation of the HbA1c measurement. Diabetologia. 2007; 50(10): 2042-2043.
8. El-Kebbi IM, Cook CB, Ziemer DC, Miller CD, Gallina DL, Phillips LS. Association of younger age with poor glycemic control and obesity in urban african americans with type 2 diabetes. Arch Intern Med. 2003; 163(1): 69-75.
9. Carter JS, Gilliland SS, Perez GE, Skipper B, Gilliland FD. Public health and clinical implications of high hemoglobin A1c levels and weight in younger adult Native American people with diabetes. Arch Intern Med. 2000; 160(22): 3471-3476.
10. American Diabetes Association. Standards of medical care in diabetes. Diabetes Care. 2006; 29 Suppl 1: S4-42.
11. Levey AS, Coresh J, Greene T, Stevens LA, Zhang YL, Hendriksen S, et al. Using standardized serum creatinine values in the modification of diet in renal disease study equation for estimating glomerular filtration rate. Ann Intern Med. 2006; 145(4): 247-254.
12. Mogensen CE, Keane WF, Bennett PH, Jerums G, Parving HH, Passa P, et al. Prevention of diabetic renal disease with special reference to microalbuminuria. Lancet. 1995; 346(8982): 1080-1084.
13. Gilliland SS, Carter JS, Skipper B, Acton KJ. HbA1c levels among American Indian/Alaska Native adults. Diabetes Care. 2002; 25(12): 2178-2183.
14. Al-Lawati JA, Mabry R, Mohammed AJ. Addressing the threat of chronic diseases in Oman. Prev Chronic Dis. 2008; 5(3): A99.
15. Food and Agricultural Organization of the United Nation (FAO). key statistics of food and agriculture external trade.; 2007 (accessed 12 March 2007).
16. Harding AH, Sargeant LA, Welch A, Oakes S, Luben RN, Bingham S, et al. Fat consumption and HbA(1c) levels: the EPIC-Norfolk study. Diabetes Care. 2001; 24(11): 1911-1916.
17. Sosa-Rubi SG, Galarraga O, Lopez-Ridaura R. Diabetes treatment and control: the effect of public health insurance for the poor in Mexico. Bull World Health Organ. 2009; 87(7): 512-519.
18. Al-Asfoor DH, al-Lawati JA, Mohammed AJ. Body fat distribution and the risk of non-insulin-dependent diabetes mellitus in the Omani population. East Mediterr Health J. 1999; 5(1): 14-20.
19. Al-Lawati JA, Mohammed AJ, Al-Hinai HQ, Jousilahti P. Prevalence of the metabolic syndrome among Omani adults. Diabetes Care. 2003; 26(6): 1781-1785.
20. de Peralta E, Patel K, Wan C, Fuentes B, Baldwin D. Culturally competent diabetic education to lower hemoglobin A1c levels of diabetic patients: Esta mejor. Tex Med. 2005; 101(6): 54-56.
21. Boule NG, Haddad E, Kenny GP, Wells GA, Sigal RJ. Effects of exercise on glycemic control and body mass in type 2 diabetes mellitus: a meta-analysis of controlled clinical trials. JAMA. 2001; 286(10): 1218-1227.
22. Jeffreys HL. Hemoglobin A1C Value for Evaluating a Community Diabetes Education Series. The Internet Journal of Advanced Nursing Practice. 2008 9(2).
23. Nitin S. HbA1c and factors other than diabetes mellitus affecting it. Singapore Med J. 2010; 51(8): 616-622.
|
|