Evidence for the health benefits of physical activity (PA) on physical, mental, and general health in adults with type 2 diabetes mellitus (T2DM) support the inclusion of effective activity interventions in clinical care.1–5 Moderate increases in PA have been shown to reduce glycated hemoglobin (HbA1c) levels, and improve glucose uptake into active muscles, hepatic glucose production, and skeletal muscle mass as well as improve fat oxidation and systemic insulin action, and reduce low-density lipid cholesterol, systolic blood pressure (SBP), and the risk of cardiovascular mortality. Increased PA has been shown to reduce depression and improve health-related quality of life (QoL).3 Hence, PA is often described as a cornerstone of diabetes care.6,7
The World Health Organization (WHO) defines health as “a state of complete physical, mental and social well-being and not merely the absence of disease or infirmity”.8 This definition embraces several dimensions of health that are described differently across studies, especially in areas related to QoL.9,10 However, most studies agree on seven dimensions for health (physical, intellectual, emotional, spiritual, social, occupational, and environmental).11 This definition helps to facilitate a comprehensive and holistic understanding of the many dimensions of health and illness that interact and overlap.
Research on health-related QoL in PA has predominately focused on elderly populations with chronic conditions (e.g., cardiovascular diseases, arthritis, pulmonary diseases, and cancer). Chronically diseased populations tend to improve their health-related QoL from increased PA.12 In addition, some studies have shown a positive association between individual domains of QoL (physical, emotional, and social) and PA level in populations with diabetes.10,13,14
PA levels have also been positively associated with sleep duration, especially in older adults.15 This association is important as a large body of evidence confirms that sleep duration is associated with disease and mortality.16 Evidence indicates that chronic sleep disturbance17 and high levels of stress18 may contribute to the risk of T2DM. Adequate, high-quality sleeping hours is a further dimension of health that may be relevant for day to day well-being.
The ‘MOVEdiabetes’ study reported that clinic-based PA intervention was associated with positive effects on PA levels, sitting time, blood pressure, and triglyceride levels.19 Our study sought to explore additional secondary outcomes, namely perceptions on general well-being in participants of the ‘MOVEdiabetes’ intervention aimed at increasing PA in adults with T2DM.
Methods
The ‘MOVEdiabetes’ study was a one-year (1 May 2016 to 1 June 2017) 1:1 cluster randomized controlled trial of the ‘MOVEdiabetes’ programme (intervention group; IG) versus usual care (control group; CG). Out of the 26 health centers in Muscat, Oman, eight were randomly selected and then randomized to deliver either the intervention (n = 4) or usual care (n = 4). The ‘MOVEdiabetes’ program utilized face-to-face PA consultations promoting 150 minutes of moderate to vigorous PA per week (600 metabolic equivalent of task (MET).mins/week),3 pedometers to self-monitor step counts, and monthly telephone WhatsApp messages for follow-up support. Inactive adults with T2DM and no contraindications to PA were recruited over two months and followed-up for 12 months. The intervention was undertaken as personalized, face-to-face consultations (maximum 20 minutes) by trained dieticians on three occasions (week 0, 4, and 8).19,20 The primary outcome was the change in levels of PA measured by the Global Physical Activity Questionnaire (GPAQ). Methods used in the ‘MOVEdiabetes’ study and the results for the primary outcome are presented elsewhere.19
Ethical approval for this study was obtained from the Regional Research Committee in Muscat, Oman Ministry of Health, within the overall ‘MOVEdiabetes’ study. All eligible participants provided informed consent before data collection. For illiterate individuals, consent to participate in this study was provided by their accompanying support member (spouse, son, or daughter).
The sample size (n) was calculated based on an estimation from formative work of the standard deviation (SD) of mean PA levels of 145.0 MET.min/week21 and mean sitting time (hours/day) of 0.2 with intra-class correlation coefficient of 0.1.22 Based on a dropout rate of 20%, 154 patients were required to participate (77 in each arm). Assuming a recruitment rate of 70%, it was estimated that 220 potential eligible patients were required.20 Based on the evidence around the positive association between PA levels and well-being,23–25 this sample size calculation was accepted by the investigating team for the analysis of data within the current study.
Several measurement tools have been developed to measure health-related outcomes/dimensions. Despite the presence of few measurement tools on QoL by the WHO26 and attempts from Oman Ministry of Health,27 these tools were not entirely sufficient to answer the questions/objectives of this study on the effects of change in PA on the various domains of health. Hence, the measurement tool used in the current study was an online English questionnaire, available as a public document (SF-20),28 that was translated to Arabic. The questionnaire was initially reviewed and modified in English before translating it into Arabic language. The translation process followed the standard guidelines for the forward and backward translation of measurement tools recommended by the WHO.29 Two of the researchers from the investigating team, including the principal investigator, who are bilingual, translated the English questionnaire into Arabic. Later, the questionnaires/scales were submitted to a professional medical translation company (Al-Maani) to evaluate the equivalency of the meaning between the two versions, identify differences, and review the final wording of the items.
We used a 13-item questionnaire to assess the effectiveness of the ‘MOVEdiabetes’ intervention on general health, sleep, mental health, pain, and QoL, which was a modified version of the short SF-20 questionnaire.28 Local PA experts in Oman Ministry of Health were approached to review the content of the questionnaire and suggest amendments where appropriate.
Due to the complexity of the questionnaire, amendments were made to achieve maximum precision while translating the questionnaire from English to Arabic. Because this study was conducted in routine diabetes settings, the questionnaire was shortened (13 out of 20 questions) for practical use, and individual item selection was based on cultural appropriateness, the inclusion of health dimensions, and ease of comprehension.
Participants were interviewed by the project officers (POs), health care practitioner in primary health care, and asked to respond to the 13 items by ranking their perceptions on general health (1 item), sleep (1 item), mental health (3 items), and pain (1 item). Questions on mental health covered feeling (calm/peaceful, energetic, and downhearted or depressed) were included. The assessment also included seven items on QoL, which covered how the participants’ general, physical, and emotional health impacted their physical abilities, work, and social activities. Participants were asked to select a response from a three (only two questions were used) or five-point Likert scale [Table 1].
A nurse from the POs team undertook piloting of the questionnaire from a population outside the sampled primary health center. Piloting procedures aimed to evaluate any (participant and interviewer perceived) strengths or weaknesses of the general well-being questionnaire, including poor comprehension and logistic constraints. The tool was piloted with 10 participants (adults with T2DM from a randomly selected health center in Muscat) in routine clinic settings. This procedure resulted in minor amendments (word changes), and no major adjustments were undertaken. Factor analysis30 revealed adequate construct validity31 of the items in the questionnaire and the Cronbach’s alpha value was calculated as 0.80 indicating good internal consistency of the questionnaire.32
Proportions of responses at baseline and 12 months from the IG and CG were compared and between study group differences in proportions of ratings across the studied health domains were obtained using the chi-squared test. Furthermore, differences in responses between baseline and 12 months were then calculated and categorized into ‘improved’ (if the score was in a favorable direction), ‘no change’ (if score was 0), or ‘worsen’ (if score was in an unfavorable direction). Between groups differences in the proportions of the categorized responses were then obtained using chi-squared test. Adjustments to the Pearson chi-square were based on Brier’s statistic (X2b) assuming that the clustering effect within the treatment groups was homogeneous.33
Additionally, Spearman’s correlation analysis was utilized to find associations between changes (as ordinal variables) in general health, sleep, mental health, pain, and QoL with the change in self-reported PA levels (MET.min/week) presented elsewhere using GPAQ.19
Further, the construct validity of the assessment tool used in this study was assessed using exploratory and confirmatory factor analysis (EFA and CFA, respectively)34 using the R statistical software.35
Table 1: Participants’ sociodemographic characteristics in the ‘MOVEdiabetes’ study.
|
Gender |
|
|
|
Male |
56 (45.9) |
39 (35.5) |
|
Female |
66 (54.1) |
71 (64.5) |
|
Age, mean ± SD, years |
43.5 ± 7.1 |
45.1 ± 9.2 |
|
≤ 44 |
65 (53.3) |
48 (43.6) |
|
> 44 |
57 (46.7) |
62 (56.4) |
|
Marital status |
|
Unmarried |
32 (26.2) |
16 (14.5) |
|
Married |
90 (73.8) |
94 (85.5) |
|
Education |
|
|
|
≤ Secondary |
62 (50.8) |
52 (47.3) |
|
> Secondary |
60 (49.2) |
58 (52.7) |
|
Income, Omani Rials/month* |
|
≤ 1000 |
70 (57.4) |
55 (50.0) |
|
> 1000 |
41 (33.6) |
37 (33.6) |
|
Employment |
|
|
|
Currently unemployed |
42 (34.4) |
55 (50.0) |
|
Currently employed |
80 (65.6) |
55 (50.0) |
|
Duration of diabetes, mean ± SD, years |
6.4 ± 4.5 |
5.3 ± 2.6 |
|
≤ 5 |
63 (51.6) |
52 (47.3) |
|
> 5 |
59 (48.4) |
58 (52.7) |
|
Comorbidities** |
|
No comorbidities |
27 (22.1) |
26 (23.6) |
|
With comorbidities |
95 (77.9) |
84 (76.4) |
|
Diabetes medication |
|
Diet only |
7 (5.7) |
5 (4.5) |
|
Oral hypoglycemic drugs |
103 (84.4) |
85 (77.3) |
Data presented as n (%) unless otherwise stated.
*29 missing values due to reporting ‘I don’t know’.
**Presence of hypertension, hyperlipidemia, thyroid, or any other condition coinciding with diabetes registered in the health information system.
Results
The populations’ sociodemographic, anthropometric, and physiological characteristics were described elsewhere.19 In summary, out of 232 participants who completed baseline study measurements, 174 (75.0%) completed the final 12 month follow-up study period. At baseline, more than half of participants in both the IG and CG were female (54.1 and 64.5%, respectively), and the mean age of the total population was 44.2±8.1 years. The majority of the population were married, employed, and above half had completed their secondary education [Table 1].
At baseline, the mean body mass index (BMI) was > 30 kg/m2 in both groups. Many participants had comorbidities; hypertension (45.3%), hyperlipidemia (35.6%), or both (15.0%). HbA1c was > 7% in both study groups (71% in IG vs. 58% in CG), indicating poor diabetes control according to the Omani diabetes management guidelines.36 There were no statistical significance between-group differences in BMI, SBP, HbA1c, and lipid profile at baseline [Table 1].
Looking overall at the results of the questions at the population level and on wider health domains at 12 months and baseline provides insight into some general health issues in this study population. The whole sample (n = 232) showed a range of responses across the studied health domains [Figure 1]. Notably, at 12 months from baseline, the greatest proportions of ratings were positive, and this was the case in most health domains [Table 2].19
The consort flow chart for this study has been published earlier;19 however, it is essential to report that 82 (67.2%) participants in the IG versus 92 (83.6%) in the CG completed the study at 12 months follow-up. Reasons for attrition included feeling uncomfortable with measurement devices (41%), lost to follow-up (17%), pain (14%), travel (12%), not interested (9%), and long study (7%).19
Reporting ‘all/most of the times’ to feeling calm/peaceful and energetic increased at 12 months from baseline. Overall, there were significant differences in proportions for the ratings for feeling calm/peaceful (p < 0.001) and energetic (p = 0.020), but not for feeling downhearted or depressed at 12 months from baseline (p = 0.900).
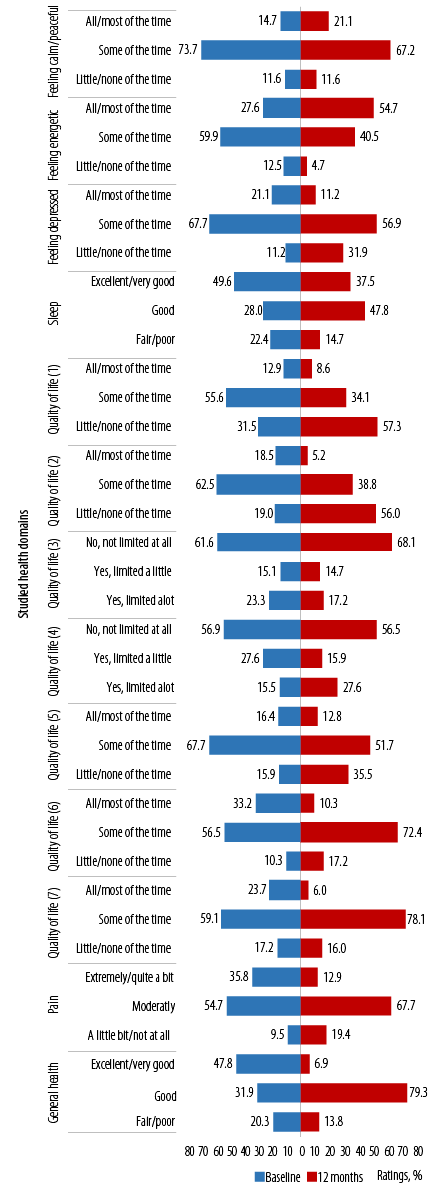
(1) Accomplished less because of physical health; (2) limitations as a result of physical health; (3) limitations in the amounts of vigorous activities; (4) limitations in the amounts of moderate activities; (5) accomplished less because of emotional problems; (6) limitations as a result of emotional problems; (7) physical health and emotional problems interfering with social activities.
Figure 1: Ratings on items in the general well-being questionnaire across the studied health domains at population level (baseline and 12 months).
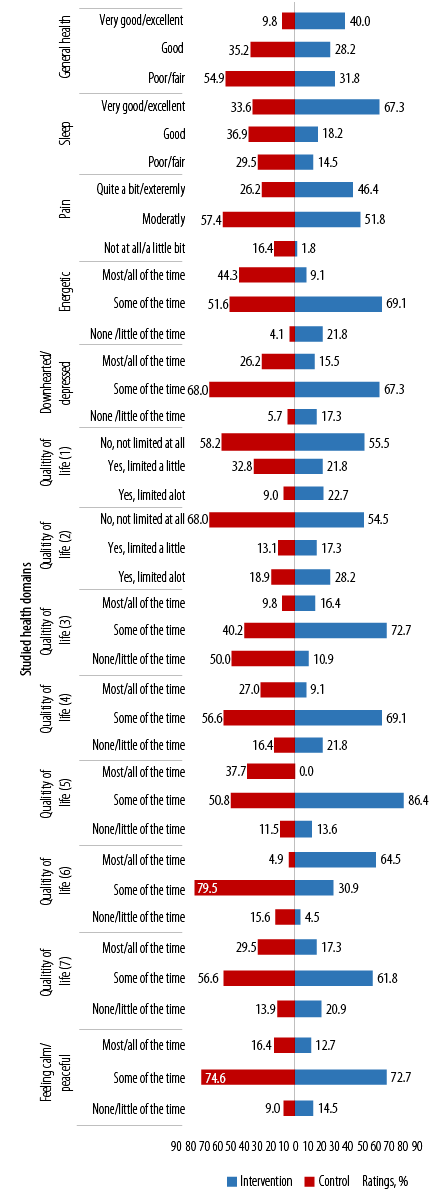
(1) Limitations in the amounts of moderate activities; (2) limitations in the amounts of vigorous activities; (3) accomplished less because of physical health; (4) limitations as a result of physical health; (5) accomplished less because of emotional problems; (6) limitations as a result of emotional problems; (7) physical health and emotional problems interfering with social activities.
Figure 2: Between study groups’ ratings on items in the general well-being questionnaire across the studied health domains at baseline.
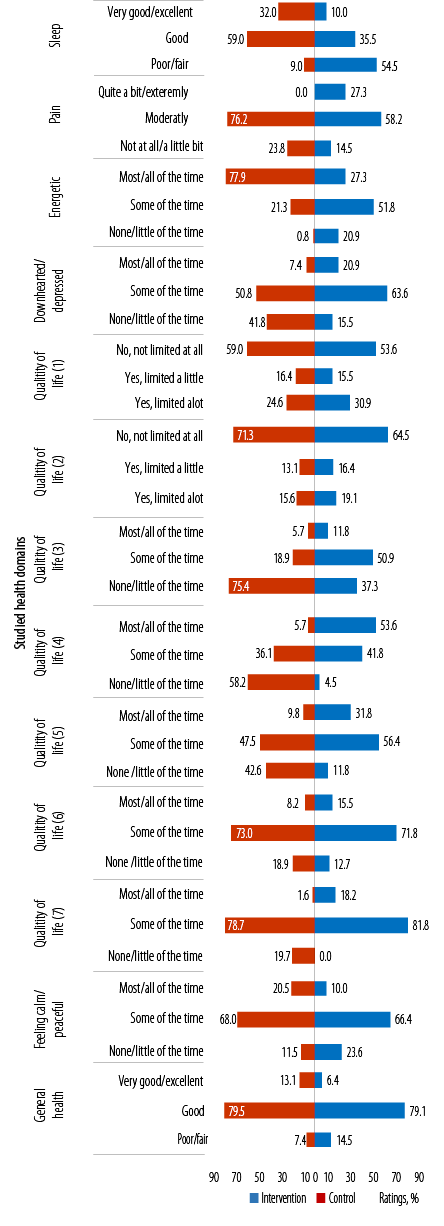
(1)Limitations in the amounts of moderate activities; (2) limitations in the amounts of vigorous activities, (3) accomplished less because of physical health; (4) limitations as a result of physical health; (5) accomplished less because of emotional problems; (6) limitations as a result of emotional problems; (7) physical health and emotional problems interfering with social activities.
Figure 3: Between the study groups’ ratings on items in the general well-being questionnaire across the studied health domains at 12 months.
Ratings for sleep seemed to improve at 12 months from baseline (reporting fair/poor reduced from 22.4% to 14.7%). Overall, ratings for sleep were significantly different at 12 months from baseline (p = 0.010).
In general, ratings across all the items related to QoL showed improvements at 12 months from baseline. However, significant differences in the proportion of ratings at 12 months from baseline were noted for ‘accomplishing less because of physical health’ [QoL1 (p < 0.001)], ‘limitations as a result of physical health’ [QoL2 (p < 0.001)], and ‘limitations on amounts of vigorous activities’ [QoL3 (p = 0.030)] [Figure 1].
Pain (reported as ‘extremely/quite a bit’) reduced from 35.8% at baseline to 12.9% at 12 months. Similarly, ratings of ‘fair/poor’ to general health reduced from 20.3% to 13.8%. However, the differences in proportion of responses were not significant neither for pain nor for general health (p = 0.400 and p = 0.100, respectively) [Figure 1].
At baseline, between-group differences in the proportion of ratings were significantly better (in favor of the IG) in most variables. The exceptions were: a) feeling calm/peaceful, where most participants in both study groups felt calm/peaceful ‘some of the time’, b) social restrictions as a result of physical and emotional health, and c) limitation in vigorous activities [Figure 2].
At baseline, more than half (54.9%) of the participants in the IG rated their general health as poor/fair versus 31.8% in the CG, indicating poor perceptions of general health in the IG (p < 0.001). A third (33.6%) of the IG versus the majority of the participants in the CG perceived their sleeping as very good to excellent (p < 0.001). However, more than half of the participants in both study groups perceived pain as moderate (p < 0.001), felt energetic some of the time (p < 0.001), and felt downhearted/depressed some of the time (p = 0.007).
Ratings for questions on QoL varied between the study groups. At baseline, a greater proportion of participants in the IG compared to CG felt they were ‘not’, or ‘only a little of the time’ limited by physical health (p < 0.001), or accomplished less due to physical health (p = 0.002), and that their health did not limit the kinds and amounts of moderate PA they could do (p = 0.003).
Notably (with the exception for ratings on limitations as a result of emotional problems), a greater proportion of participants in both study groups perceived limitations to all the other questions on QoL ‘some of the time’ [Figure 2].
At 12 months, between study groups differences in proportions of ratings for sleep, feeling pain, energetic, and downhearted or depressed were significant (p = 0.001, p < 0.001, p < 0.001, and p < 0.001, respectively). Greater proportions of participants in the the IG versus CG reported ‘very good/excellent’ sleep, ‘not at all/a little bit’ of pain, feeling energetic ‘most/all of the time’, and downhearted or depressed ‘none/little of the time’ (32.0% vs. 10.0%, 23.8% vs. 14.5%, 77.9% vs. 27.3%, and 41.8% vs. 15.5%, respectively) [Figure 3].
Between groups, ratings for QoL were not significantly different except for items on 'accomplishing less because of physical health' [QoL3 (p < 0.001)] [Figure 3]. Overall, a greater proportion of participants in the IG versus CG had favorable ratings for all questions on QoL. More than half of the participants in the IG versus CG rated limitations to moderate and vigorous PA (QoL1 and 2) as ‘no not limited at all’. Similarly, a greater proportion of participants in the IG rated ‘none/little of the time’ to accomplishing less and limitations due to physical health (QoL3 and 4). Around half of the participants in both study groups rated ‘some of the time’ to accomplishing less due to emotional health (QoL5). Most participants of both study groups rated limitations due to emotional health (QoL6) and social restrictions (QoL7) as ‘some of the time’ [Figure 3].
At 12 months, most participants in both study groups rated ‘some of the time’ to feeling calm/peaceful and ‘good’ for general health. Between-group differences in these ratings were not significant.
Between group differences in responses at 12 months from baseline was categorized as indicated in Table 2. The proportion of participants who improved was greater in the IG versus CG in all the items in the questionnaire except for questions 3 (limitations in the kinds or amounts of moderate activity) and 5 (feeling calm and peaceful), where improvement was greater in the CG versus IG. Notably, the proportion of participants who worsened was lower in the IG versus CG for all questions except question 5 (accomplishing less due to physical health) where both the study groups had a similar proportion of participant who worsened (16.4%), and question 6 where a higher proportion worsened in the IG than the CG (18.9% vs. 10.0%).
The differences in the proportion of individuals who improved versus did not change versus worsened was significant for questions 1 [general health (p = 0.020)] and 6 to 11 [limitations due to physical problems (p = 0.020), accomplished less due to emotional problems (p = 0.030), limitations due to emotional problems (p < 0.001), limitations due to pain (p = 0.020), feeling peaceful and calm (p = 0.040), and energetic (p < 0.001)]. All improvements were in favor of the IG [Table 2]. Differences in proportions were borderline (p = 0.050) for perceptions on sleep (Q2) and social restrictions (Q13).
Positive, significant associations were shown between changes in self-reported PA (MET.min/week) and the health domains in the questionnaire for both the IG and CG on responses for general health (r = 0.70 and 0.36, p < 0.001), feeling calm/peaceful (r = 0.86 and 0.93, p < 0.001), and feeling energetic (r = 0.86 and 0.82, p < 0.001). Additionally, a strong negative association was revealed between change in PA levels and changes in feeling depressed (r = -0.35, p < 0.001 and r = -0.30, p = 0.001). Other significant associations between change in PA levels within the IG were noted with restrictions due to emotional health (r = 0.26, p = 0.004) and pain (r = -0.29, p = 0.001). However, sleep was significantly associated with PA levels within the CG (r = 0.35, p = 0.005) [Table 2].
Construct validity of changes to the responses in the questionnaire was carried out using factor analysis. Results from EFA indicated the suitability of all the 13 items/questions in the questionnaire within this study population. Five factors were identified to explain the variability within the responses that corresponded to the studied health dimensions (general health, sleep, mental health, pain, and QoL). No significant inter-item correlations were identified indicating minimal inter-item interactions. However, the Cronbach’s alpha test revealed poor internal consistency of this tool in this study population (values = 0.50). Additionally, two measurement models were tested using CFA: a) one-factor model that forced all items to load on a single latent factor ‘general well-being’, and b) a five-factor model that specified the 13-items to load on five factors as per the study questionnaire designed. The CFA results for the entire sample showed that the one-factor model with all items loading on a single factor showed poor overall fit to the observed data (χ2 = 29 810, df = 29, p < 0.0001, CFI = 0.68, root mean square error of approximation (RMSEA) = 0.14). The five-factor model that forms the basis of this study questionnaire was found to provide better fit (χ2 = 6473, df = 42, p < 0.0001, CFI = 0.89, RMSEA = 0.05). Notably, the RMSEA for the five-factor model indicates the opportunity for improvements in the model fit.
Table 2: Between-group differences in the proportion of responses to questions on general health, sleep, mental health, and quality of health (improved, no change, or worsened), and correlation with changes in physical activity levels (metabolic equivalent of task (MET).min/week).
Correlation with change in MET.min/week
0.13*
0.26**
0.03
|
Q1. In general, would you say your health is? |
7.880
0.020 |
|
Improved |
95 (40.9) |
59 (48.4) |
36 (32.7) |
|
No change |
50 (21.6) |
27 (22.1) |
23 (20.9) |
|
Worsened |
87 (37.5) |
36 (29.5) |
51 (46.4) |
|
Correlation with change in MET.min/week |
0.55** |
0.70** |
0.36** |
|
Q2. In general, would you say your sleep is? |
5.840
0.050 |
|
Improved |
101 (43.5) |
55 (45.1) |
46 (41.8) |
|
No change |
65 (28.0) |
40 (32.8) |
25 (22.7) |
|
Worsened |
66 (28.4) |
27 (22.1) |
39 (35.5) |
|
Correlation with change in MET.min/week |
0.28** |
0.18 |
0.35** |
|
Q3. Does your health now limit you in the kinds or amounts of moderate activities you can do, like moving a table, carrying groceries, or bowling?*** |
1.570
0.460 |
|
Improved |
82 (35.3) |
43 (35.2) |
39 (35.5) |
|
No change |
82 (35.3) |
47 (38.5) |
35 (31.8) |
|
Worsened |
68 (29.3) |
32 (26.2) |
36 (32.7) |
|
Correlation with change in MET.min/week |
-0.05 |
-0.11 |
0.008 |
|
Q4. Does your health now limit you in the kinds or amounts of vigorous activities you can do, like lifting heavy objects, running or participating in strenuous sports?*** |
3.560
0.170 |
|
Improved |
49 (21.1) |
26 (21.3) |
23 (20.9) |
|
No change |
118 (50.9) |
68 (55.7) |
50 (45.5) |
|
Worsened |
65 (28.0) |
28 (23.0) |
37 (33.6) |
|
Correlation with change in MET.min/week |
-0.04 |
-0.11 |
0.06 |
|
Q5. How much of the time have you accomplished less in certain kinds or amounts of work, or housework, because of your physical health?*** |
0.240
0.890 |
|
Improved |
104 (44.8) |
53 (43.4) |
51 (46.4) |
|
No change |
90 (38.8) |
49 (40.2) |
41 (37.3) |
|
Worsened |
38 (16.4) |
20 (16.4) |
18 (16.4) |
|
Correlation with change in MET.min/week |
-0.11 |
-0.09 |
-0.12 |
|
Q6. How much of the time you had limitations in the kind of work or other activities as a result of your physical health?*** |
7.800
0.020 |
|
Improved |
141 (60.8) |
77 (63.1) |
64 (58.2) |
|
No change |
57 (24.6) |
22 (18.0) |
35 (31.8) |
|
Worsened |
34 (14.7) |
23 (18.9) |
11 (10.0) |
|
Correlation with change in MET.min/week |
-0.15 |
-0.11 |
-0.17 |
|
Q7. How much of the time have you accomplished less in certain kinds or amounts of work, or housework, because of your emotional problems (such as feeling depressed or anxious)?*** |
|
Improved |
91 (39.2) |
31 (25.4) |
13 (11.8) |
|
No change |
97 (41.8) |
46 (37.7) |
51 (46.4) |
|
Worsened |
44 (19.0) |
45 (36.9) |
46 (41.8) |
|
|
Q8. How much of the time have you had limitations in the kind of work or other activities as a result of any emotional problems (such as feeling depressed or anxious)?*** |
33.530
< 0.001 |
|
Improved |
28 (12.1) |
23 (18.9) |
5 (4.5) |
|
No change |
116 (50.0) |
73 (59.8) |
43 (39.1) |
|
Worsened |
88 (37.9) |
26 (21.3) |
62 (56.4) |
|
Correlation with change in MET.min/week |
0.04* |
0.16 |
0.01 |
|
Q9. How much bodily pain have you had during the past four weeks? |
7.440
0.020 |
|
Improved |
105 (45.3) |
56 (45.9) |
49 (44.5) |
|
No change |
55 (23.7) |
45 (36.9) |
34 (30.9) |
|
Worsened |
72 (31.0) |
21 (17.2) |
27 (24.5) |
|
Correlation with change in MET.min/week |
-0.17** |
-0.29** |
-0.06 |
|
Q10. Have you felt calm and peaceful during the last four weeks? |
6.340
0.040 |
|
Improved |
122 (52.6) |
71 (58.2) |
51 (46.4) |
|
No change |
68 (29.3) |
36 (29.5) |
32 (29.1) |
|
Worsened |
42 (18.1) |
15 (12.3) |
27 (24.5) |
|
Correlation with change in MET.min/week |
0.90** |
0.86** |
0.93** |
|
Q11. Did you have a lot of energy during the past four weeks? |
16.070
< 0.001 |
|
Improved |
122 (52.6) |
79 (64.8) |
44 (40.0) |
|
No change |
68 (29.3) |
31 (25.4) |
39 (35.5) |
|
Worsened |
42 (18.1) |
12 (9.8) |
27 (24.5) |
|
Correlation with change in MET.min/week |
0.84** |
0.86** |
0.82** |
|
Q12. Have you felt downhearted and depressed during the past four weeks? |
1.730
0.420 |
|
Improved |
136 (58.6) |
75 (61.5) |
61 (55.5) |
|
No change |
33 (14.2) |
14 (11.5) |
19 (17.3) |
|
Worsened |
63 (27.2) |
33 (27) |
30 (27.3) |
|
Correlation with change in MET.min/week |
-0.33* |
-0.35** |
-0.30* |
|
Q13. How much of the time has your physical health or emotional problems interfered with your social activities (like visiting friends, relatives)?*** |
|
Improved |
79 (34.1) |
50 (41.0) |
29 (26.4) |
|
No change |
120 (51.7) |
58 (47.5) |
62 (56.4) |
|
Worsened |
33 (14.2) |
14 (11.5) |
19 (17.3) |
* Significant results p < 0.050 ; ** significant results p < 0.050 ; *** questions on quality of life.
Discussion
Overall, these findings indicate a positive effect of the ‘MOVEdiabetes’ intervention on perceived general health, sleep, mental health, pain, and responses to QoL.
Despite positive weak associations, the relationship between change in PA levels and improvements in responses for general health was significant. A greater proportion of those in the IG versus CG perceived improvements in general health (48.4% vs. 32.7%) confirming the evidence around effects of PA on general health in patients with T2DM.1,37 These results echo the findings reported across various studies on the physical, psychological, mental, and rehabilitative benefits of PA.38–41
When the associations with PA levels were explored, feeling downhearted or depressed decreased with the increase in PA levels. This finding is consistent with evidence around PA and mental health in the general population including effects on mood, self-esteem, cognitive functioning and decline, depression, and QoL.42 PA is likely to have similar psychological benefits for persons with T2DM, although evidence for acute and chronic psychological benefits is limited.43 In the 'Look AHEAD' trial,44 participants in the intensive lifestyle intervention (participants who attempted to lose > 7% of their initial weight and increase moderately intense PA to > 175 min/week) had improvements in health-related QoL (SF-36 physical component scores) and depression symptoms after 12 months.44
Sufficient sleep is an integral part of health and well-being as it promotes memory consolidation, clearance of brain metabolites, and restoration of nervous, immune, skeletal, and muscular systems.45 Hence, sleep disturbances are associated with cardiovascular disease, metabolic dysfunction, psychiatric disorders, and early mortality.15 In older and/or patients with diabetes, adequate sleep becomes more important for controlling blood sugar lχχχvels.18 The relationship between sleep and health in the general population and in patients with diabetes has been described as bidirectional.46,47 Sleep disturbances lead to physical inactivity and the opposite is also true. Results from the current study highlighted the significant positive effect of the ‘MOVEdiabetes’ intervention on sleep. However, the association between change in PA and sleep was positively significant in the CG and not the IG. These results indicate the need for more research on whether PA interventions can bring about important improvements in duration and quality of sleep in adults with T2DM.
The finding that there were more participants with worsened perceived pain in the CG compared to the IG indicates that the intervention helped relieve pain and this is a significant finding especially that pain was one of the reasons for dropout from the study.19 Evidence around the benefits of using PA and exercise in reducing the severity of chronic pain is well reported.48 Many individuals with T2DM are obese and may present with osteoarthritic joint symptoms. Hence, prescribing PA to this population require robust assessments to address the critical factors that determine if PA could actually mediate pain.
Our results reveal a positive reflection of the health benefits of PA in addition to improving HbA1c in patients with T2DM. Hence, health care providers may prescribe PA to improve the general physical, psychological, and mental health of patients attending primary diabetes care.49,50 This approach of promoting PA in the clinical setting is essential as it is of direct relevance to the national health policy priorities in Oman5 “to promote the health awareness of the community and establish a culture of healthy lifestyles”.51
One of the limitations of this study was its interview-based nature where participants may have been influenced to report positive outcomes to their health care providers who interviewed them. However, it might be argued that complex questionnaires such as the one used in this study, may be better if explained via interviews instead of self-reports. Future studies may equally consider in-depth qualitative approaches (focus group discussions/interviews) to explore the health outcomes from performing PA in adults with T2DM with self-reported responses.
Another limitation is related to the fact that the tool used in this study has been largely utilized in general and specific populations in Western societies and may not be entirely culturally appropriate for Arab populations. Additionally, the translation and shortening of the questionnaire, which may have jeopardized the information needed to explain the health dimensions comprehensively. Given the anticipated increase in work load and possibility of intervention subject burden, the ‘MOVEdiabetes’ measurement tools including the well-being questionnaire, were selected with minimum data set requirements.
Finally, findings from this study should be considered with some caution given that the ‘MOVEdiabetes’ study was not designed to measure these factors as primary outcomes. Consequently, the tool used to assess general well-being showed poor internal consistency in the current study population. This finding may also be attributed to the cross cultural uncertainties and differences in responding to Likert scales.51 In addition, culturally specific factors may have influenced the reliability of the assessment measures in this study.52,53 Further studies are needed to identify robust general well-being assessment tools in Arabic speaking countries where such evidence is scarce.
Conclusion
Overall, this paper has highlighted the positive impact of the ‘MOVEdiabetes’ intervention on improvements in well-being related to general health, sleep, mental health, pain, and QoL. The association between changes in PA level was positively significant with changes in general health, feeling calm/peaceful, and energetic. Additionally, a strong negative association was revealed between change in PA level and change in feeling depressed. Specifically within the IG, we noted a positive association between change in PA levels and changes in perceptions on restrictions due to emotional health and pain. However, it is important to be cautious in drawing conclusions given that the internal consistency of the measurement tool was poor. Further studies are needed to identify robust tools to measure the multi-dimensions of health/well-being for PA interventions in adults with T2DM in Arabic speaking countries.
Disclosure
The authors declared no conflict of interests. Oman Ministry of Health has funded this project as part of PhD grants offered to the corresponding author.
Acknowledgements
The authors thank the Ministry of Health of Oman for sponsoring this project, especially Dr. Ahmed Al-Qasmi and Dr. Fatma Al-Ajmi. Additionally, special thanks to Dr. Adil Al-Wahaibi for his assistance with the study statistics. Finally, many thanks to all POs who participated in the conduction of this study and showed extraordinary levels of commitment and responsibility over the 12 months study period: Miss Fatheya Al-Jufaili, Dr. Salma Al-Kalbani, Dr. Naama Al-Rawahi, Dr. Nasir Al-Balushi, Dr. Amira Al-Rahbi, Dr. Anbarin Al-Balushi, Dr. Maya Al-Kindi, Dr. Amal Al-Sedairi, Dr. Imran Masood, Mrs. Iman Al-Dalhami, Mrs. Amjaad Al-Ghammari, Mrs. Aisha Al-Riyami, Mrs. Ashwaq Al-Harthi, Mrs. Hanan Al-Kindi, Mrs. Nawal Al-Hadabi, Mrs. Fakhrya Al-Rashdi, Mrs. Sumaya Ambusaidi, and Mrs. Anwar Al-Abri.
references
- 1. Dunkley AJ, Bodicoat DH, Greaves CJ, Russell C, Yates T, Davies MJ, et al. Diabetes prevention in the real world: effectiveness of pragmatic lifestyle interventions for the prevention of type 2 diabetes and of the impact of adherence to guideline recommendations: a systematic review and meta-analysis. Diabetes Care 2014 Apr;37(4):922-933.
- 2. Ramachandran A, Snehalatha C. Diabetes prevention programs. Med Clin North Am 2011 Mar;95(2):353-372.
- 3. Colberg SR, Albright AL, Blissmer BJ, Braun B, Chasan-Taber L, Fernhall B, et al; American College of Sports Medicine; American Diabetes Association. Exercise and type 2 diabetes: American College of Sports Medicine and the American Diabetes Association: joint position statement. Exercise and type 2 diabetes. Med Sci Sports Exerc 2010 Dec;42(12):2282-2303.
- 4. Chiasson JL. Prevention of type 2 diabetes: fact or fiction? Expert Opin Pharmacother 2007 Dec;8(18):3147-3158.
- 5. Colberg SR. Physical activity: the forgotten tool for type 2 diabetes management. Front Endocrinol 2012 May;3:70.
- 6. Lee IM, Shiroma EJ, Lobelo F, Puska P, Blair SN, Katzmarzyk PT; Lancet Physical Activity Series Working Group. Effect of physical inactivity on major non-communicable diseases worldwide: an analysis of burden of disease and life expectancy. Lancet 2012 Jul;380(9838):219-229.
- 7. Heath GW, Parra DC, Sarmiento OL, Andersen LB, Owen N, Goenka S, et al; Lancet Physical Activity Series Working Group. Evidence-based intervention in physical activity: lessons from around the world. Lancet 2012 Jul;380(9838):272-281.
- 8. World Health Organization. Constitution. WHO remains firmly committed to the principles set out in the preamble to the Constitution. 2016 [cited 2017 February 12]. Available from: http://www.who.int/about/mission/en/.
- 9. Jormfeldt H. Supporting positive dimensions of health, challenges in mental health care. Int J Qual Stud Health Well-being 2011;6(2).
- 10. Bize R, Johnson JA, Plotnikoff RC. Physical activity level and health-related quality of life in the general adult population: a systematic review. Prev Med 2007 Dec;45(6):401-415.
- 11. Hjelm J. The dimensions of health: conceptual models. Jones & Bartlett Learning; 2010.
- 12. Rejeski WJ, Brawley LR, Shumaker SA. Physical activity and health-related quality of life. Exerc Sport Sci Rev 1996;24(1):71-108.
- 13. Chyun DA, Melkus GD, Katten DM, Price WJ, Davey JA, Grey N, et al. The association of psychological factors, physical activity, neuropathy, and quality of life in type 2 diabetes. Biol Res Nurs 2006 Apr;7(4):279-288.
- 14. Maddigan SL, Majumdar SR, Johnson JA. Understanding the complex associations between patient-provider relationships, self-care behaviours, and health-related quality of life in type 2 diabetes: a structural equation modeling approach. Qual Life Res 2005 Aug;14(6):1489-1500.
- 15. Garfield V, Llewellyn CH, Kumari M. The relationship between physical activity, sleep duration and depressive symptoms in older adults: the English longitudinal study of ageing (ELSA). Prev Med Rep 2016 Sep;4:512-516.
- 16. Cappuccio FP, D’Elia L, Strazzullo P, Miller MA. Sleep duration and all-cause mortality: a systematic review and meta-analysis of prospective studies. Sleep 2010 May;33(5):585-592.
- 17. Shan Z, Ma H, Xie M, Yan P, Guo Y, Bao W, et al. Sleep duration and risk of type 2 diabetes: a meta-analysis of prospective studies. Diabetes Care 2015 Mar;38(3):529-537.
- 18. Hilliard ME, Yi-Frazier JP, Hessler D, Butler AM, Anderson BJ, Jaser S. Stress and A1c among people with diabetes across the lifespan. Curr Diab Rep 2016 Aug;16(8):67.
- 19. Alghafri TS, Alharthi SM, Al-Farsi Y, Alrawahi AH, Bannerman E, Craigie AM, et al. ‘MOVEdiabetes’: a cluster randomized controlled trial to increase physical activity in adults with type 2 diabetes in primary health in Oman. BMJ Open Diabetes Research and Care 2018;6(1).
- 20. Alghafri TS, Alharthi SM, Al-Farsi YM, Craigie AM, Mcleod M, Anderson AS. Study protocol for “MOVEdiabetes”: a trial to promote physical activity for adults with type 2 diabetes in primary health care in Oman. BMC Public Health 2017 Jan;17(1):28.
- 21. Alghafri TS, Alharthi SM, Al-Farsi Y, Bannerman E, Craigie AM, Anderson AS. Correlates of physical activity and sitting time in adults with type 2 diabetes attending primary healthcare in Oman. BMC Public Health 2017 Aug;18(1):85.
- 22. Masood M, Reidpath DD. Intraclass correlation and design effect in BMI, physical activity and diet: a cross-sectional study of 56 countries. BMJ Open 2016 Jan;6(1):e008173.
- 23. Biswas A, Oh PI, Faulkner GE, et al. Sedentary time and its association with risk for disease incidence, mortality, and hospitalization in adultsa systematic review and meta-analysissedentary time and disease incidence, mortality, and hospitalization. Ann Intern Med 2015;162(2):123-132.
- 24. Williams DM, Anderson ES, Winett RA. A review of the outcome expectancy construct in physical activity research. Annals Behav Med 2005;29(1):70-79 .
- 25. Zanuso S, Jimenez A, Pugliese G, Corigliano G, Balducci S. Exercise for the management of type 2 diabetes: a review of the evidence. Acta Diabetol 2010 Mar;47(1):15-22.
- 26. World Health Organization. The world health organization quality of life (WHOQOL). 2018 [cited 2017 March 15]. Available from: https://www.who.int/mental_health/publications/whoqol/en/.
- 27. Oman Ministry of Health. Oman National Health survey. In: Planning, editor.; 2000. [cited 2019 July 23]. Available from: http://ghdx.healthdata.org/record/oman-national-health-survey-2000.
- 28. Rand health care. 20-Item short form survey (SF-20). 2015 [cited 2017 June 22]. Available from: https://www.rand.org/health/surveys_tools/mos/20-item-short-form.html.
- 29. World Health Organization. Process of translation and adaptation of instruments. 2017 [cited 2017 March 15]. Available from: http://www.who.int/substance_abuse/research_tools/translation/en/.
- 30. Tobias S, Carlson JE. Brief report: Bartlett’s test of sphericity and chance findings in factor analysis. Multivariate Behav Res 1969 Jul;4(3):375-377.
- 31. Cronbach LJ, Meehl PE. Construct validity in psychological tests. Psychol Bull 1955 Jul;52(4):281-302.
- 32. Cronbach LJ. Coefficient alpha and the internal structure of tests. Psychometrika 1951;16(3):297-334.
- 33. Reed JF III. Adjusted chi-square statistics: application to clustered binary data in primary care. Ann Fam Med 2004 May-Jun;2(3):201-203.
- 34. Prudon P. Confirmatory factor analysis as a tool in research using questionnaires: a critique. Comprehensive Psychology 2015;4:03-CP.
- 35. R Development Core Team. 2014 [cited 2017 March 15]. Available from: http://r-development-core-team.software.informer.com/.
- 36. Ministry of Health Oman. Diabetes management guidelines. In: centre E, editor. Oman: MOH; 2015 [cited 2019 July 23]. Available from: https://www.moh.gov.om/documents/272928/1314763/Diabetes+Mellitus+management+guidelines+3rd+edition+++2015%281%29.pdf/bafeceed-1a79-4e78-9166-9afee4ad3bf9.
- 37. American Diabetes Association. Executive summary: standards of medical care in diabetes–2013. Diabetes Care 2013;34(Suppl 1):S4-S10.
- 38. Abduelkarem A, Sackville M. Changes of some health indicators in patients with type 2 diabetes: a prospective study in three community pharmacies in Sharjah, United Arab Emirates. Libyan J Med 2009 Mar;4(1):31-36.
- 39. Church TS, Blair SN, Cocreham S, Johannsen N, Johnson W, Kramer K, et al. Effects of aerobic and resistance training on hemoglobin A1c levels in patients with type 2 diabetes: a randomized controlled trial. JAMA 2010 Nov;304(20):2253-2262.
- 40. World Health Organization. Social determinants of health: the solid facts. 2003 [cited 2018 June 10]. Available from: http://www.euro.who.int/__data/assets/pdf_file/0005/98438/e81384.pdf.
- 41. Arem H, Moore SC, Patel A, Hartge P, Berrington de Gonzalez A, Visvanathan K, et al. Leisure time physical activity and mortality: a detailed pooled analysis of the dose-response relationship. JAMA Intern Med 2015 Jun;175(6):959-967.
- 42. Biddle S. Physical activity and mental health: evidence is growing. World Psychiatry 2016 Jun;15(2):176-177.
- 43. Colberg SR, Sigal RJ, Fernhall B, Regensteiner JG, Blissmer BJ, Rubin RR, et al; American College of Sports Medicine; American Diabetes Association. Exercise and type 2 diabetes: the American college of sports medicine and the American diabetes association: joint position statement. Diabetes Care 2010 Dec;33(12):e147-e167.
- 44. Williamson DA, Rejeski J, Lang W, Van Dorsten B, Fabricatore AN, Toledo K; Look AHEAD Research Group. Impact of a weight management program on health-related quality of life in overweight adults with type 2 diabetes. Arch Intern Med 2009 Jan;169(2):163-171.
- 45. Luyster FS, Strollo PJ Jr, Zee PC, Walsh JK; Boards of Directors of the American Academy of Sleep Medicine and the Sleep Research Society. Sleep: a health imperative. Sleep 2012 Jun;35(6):727-734.
- 46. Kline CE. The bidirectional relationship between exercise and sleep: Implications for exercise adherence and sleep improvement. Am J Lifestyle Med 2014 Nov-Dec;8(6):375-379.
- 47. Bromley LE, Booth JN III, Kilkus JM, Imperial JG, Penev PD. Sleep restriction decreases the physical activity of adults at risk for type 2 diabetes. Sleep 2012 Jul;35(7):977-984.
- 48. Geneen LJ, Moore RA, Clarke C, Martin D, Colvin LA, Smith BH. Physical activity and exercise for chronic pain in adults: an overview of Cochrane Reviews. Cochrane Database of Syst Rev 2017;1:CD011279.
- 49. Yanai H, Adachi H, Masui Y, Katsuyama H, Kawaguchi A, Hakoshima M, et al. Exercise therapy for patients with type 2 diabetes: a narrative review. J Clin Med Res 2018 May;10(5):365-369.
- 50. Bird SR, Hawley JA. Exercise and type 2 diabetes: new prescription for an old problem. Maturitas 2012 Aug;72(4):311-316.
- 51. Oman Health Vision 2050. 2012. [cited 2019 July 23]. Available from: https://www.moh.gov.om/en/web/directorate-general-of-planning/resources
- 52. Lee JW, Jones PS, Mineyama Y, Zhang XE. Cultural differences in responses to a Likert scale. Res Nurs Health 2002 Aug;25(4):295-306.
- 53. Lau AL, Cummins RA, McPherson W. An investigation into the cross-cultural equivalence of the personal well-being index. Soc Indic Res 2005;72(3):403-430.