Magnetic resonance imaging (MRI) is widely used as a powerful diagnostic tool in medical research due to its excellent temporal and spatial resolution, the absence of ionizing radiation, fast image acquisition, and deep penetration in tissues.1,2 This modality depends on the hydrogen relaxation times in water molecules,3 which simultaneously provides anatomic, functional, and molecular information. In addition to ongoing growth in the application of MRI in routine clinical practice and molecular imaging, there have been few reports on the application of MRI to visualize carbon nanotubes (CNT) due to their poor contrast.4
Contrast agents are used in most MRI diagnosis to enhance the signal level and improve tissue contrast.5 Gadolinium (Gd) ions due to their physical properties such as large magnetic moment, relative long electron spin relaxation time, and high relaxivity compared to other paramagnetic metal ions,5 are the most used contrast agents clinically in the form of paramagnetic Gd chelates such as Gd-DTPA (Magnevist®), Gd-DOTA (Dotarem®), Gd-HP-DO3A (ProHance®), and Gd-BOPTA (Multihance®). They generally increase signal intensity by decreasing the longitudinal relaxation time of surrounding water protons.6 Paramagnetic gadolinium (Gd3þ) metal ion-based complexes are also used clinically as T1 relaxation agents, and the capability of Gd3þ-containing CNT as MRI contrast agents has been assessed.7–10
Recently, CNT have been focused as agents for drug delivery, therapeutic, and diagnostic modalities.11–15 In the last two decades, single-walled carbon nanotubes (SWCNT) have gained enormous attention in biomedical research.16,17 Their structure enables them to be the choice for nanoscale confinement, external surface functionalization to be biocompatible for biological targeting, and multifunctional drug delivery agents.18–23
In this study, SWCNTs were functionalized, PE (polyethylene) gylated and loaded with Gd to enhance image contrast and the results were compared with commercial contrast agent Gadovist®.
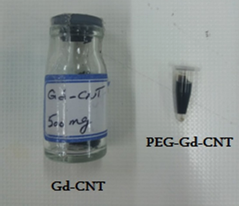
Figure 1: Synthesized Gd-CNT and Gdn3+@CNTs-PEG.
methods
SWCNT (outer diameter 1–2 nm, and length of 5–30 μm, US Research Nanomaterials Inc.) were oxidized according to the previously reported procedure.24 SWCNTs 1.00 g was added to a 15 mL mixture of sulfuric acid and nitric acid (3:1 v/v) in a balloon and was bath-sonicated for 30 minutes (Pars Nahand Eng. Co., Tehran, Iran). It was then refluxed for 21 hours at 120 °C, cooled and diluted with double distilled water (1 L), filtered and washed with deionized water to reach pH ≈ 4. Finally, the remaining yield was dried using an electric oven.
Oxidized SWCNT were loaded with gadolinium chloride (GdCl3) by mixing 0.84 mg of oxidized SWCNT (O-SWCNT) and 0.84 mg of GdCl3.6H2O (REacton W, 99.9%) rigorously in 25 ml deionized water followed by bath-sonication (Pars Nahand Eng. Co., Tehran, Iran) for one hour. The mixture was placed overnight at room temperature undisturbed to flocculate Gd3+-loaded oxidized CNT (Gdn3+@CNTs) from the mix, and the supernatant was gently decanted. Any remaining sediment was dispersed in deionized water using a bath sonicator, and the previous step was repeated to remove any unabsorbed GdCl3. This procedure was repeated three times, and the product was dried in an electric oven.
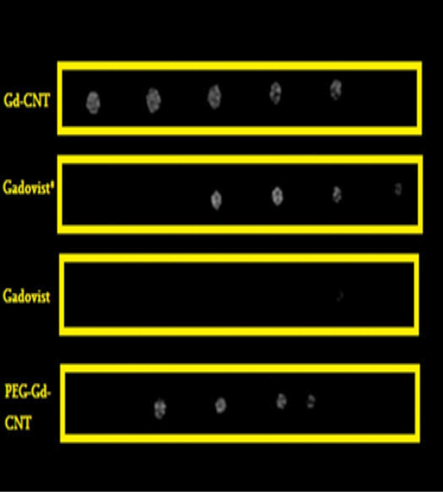
Figure 2: Signal intensity versus concentration of gadolinium
To PEGylate the product, 89.00 mg of Gdn3+@CNTs mixed with 1500.00 mg polyethylene glycol (PEG) bis (3-aminopropyl) terminated Mn~1500 (Sigma-Aldrich, Missouri, USA) and the mixture was stirred at a temperature of 120 °C under a gentle nitrogen purge for one week. The product was dialyzed against water with a dialysis bag (~14KDa cut-off) for three days after the free PEG was removed completely. The remaining product in dialysis bag was centrifuged at 14000 rpm for 15 minutes three-times to remove large nanotube bundles and the supernatant was freeze-dried [Figure 1].
Transmission electron microscopy (TEM)1 (LEO 906E, Carl Zeiss, Germany) and dynamic light scattering (DLS)2 (Malvern Instruments, Malvern, UK) were performed to gather the size and morphology information of the final product.
Inductively coupled plasma (ICP)3 (Agilent Series 4500; Agilent, Santa Clara, USA) analysis was performed to determine the Gd content in the final product in PEGylated and non-PEGylated forms. The product was digested with nitric acid (a strong oxidizing agent) to prepare the samples.
Finally, the solutions were poured into identical vials at different known concentrations for MRI, which was performed using a 1.5T clinical MRI Scanner (GE Healthcare, USA) at 27 ºC.
Table 1: Magnetic resonance imaging scan parameters.
|
Time of repetition |
200.0 ms |
|
Time of echo |
2.6 ms |
|
Field of view |
16 × 16 cm2 |
|
Matrix size |
384 × 192 mm3 |
|
Number of excitation |
1.0 |
|
Slice thickness |
2.0 mm |
Results
The imaging parameters are given in Table 1 and applied spin echo sequence and quadkneespan class ® coil. After completing the imaging procedure, the obtained images were analyzed off-line using the software available on the MRI unit.
The T1-W images and quantitative signal intensity of Gdn3+@CNTs-PEG, Gd-CNT and Gadovist® samples with different Gd concentrations were demonstrated in Figure 2 and Table 2. The signal intensities of vials with corresponded Gd concentrations, which were serially diluted, were recorded after image acquisition and analysis.
We loaded Gd on PEGylated SWCNT. The relaxivity of Gd-based contrast agents is partly dependent on the number of Gd per nano-carrier and their exchange rate with surrounding water protons.25 The relaxivity of the synthesized Gdn3+@CNTs-PEG, Gd-CNT, and commercial contrast agent, Gadovist® are given in Figure 3.
Table 2: Concentrations of Gdn3+@CNTs-PEG, Gd-CNT, Gadovist®, and signal intensity.
|
Gdn3+@CNTs-PEG |
1 |
0.11 |
6.3 |
274.74 |
|
2 |
0.05 |
12.5 |
345.59 |
|
3 |
0.02 |
25.0 |
400.07 |
|
4 |
0.01 |
50.0 |
367.20 |
|
5 |
0.00 |
100 |
0 |
|
Gd-CNT |
1 |
0.05 |
6.3 |
320.49 |
|
2 |
0.11 |
12.5 |
308.92 |
|
3 |
0.22 |
25.0 |
356.00 |
|
4 |
0.44 |
50.0 |
365.64 |
|
5 |
0.88 |
100 |
385.62 |
|
1 |
0.00 |
0.001 |
247.85 |
|
2 |
0.01 |
0.01 |
334.53 |
|
3 |
0.15 |
0.1 |
443.49 |
|
4 |
1.57 |
1.0 |
432.42 |
|
5 |
9.81 |
6.3 |
150.52 |
|
6 |
19.62 |
12.5 |
0* |
|
7 |
21.16 |
25.0 |
0* |
|
8 |
39.25 |
50.0 |
0* |
*The value is due to high gadolinium (Gd) concentration in vials.
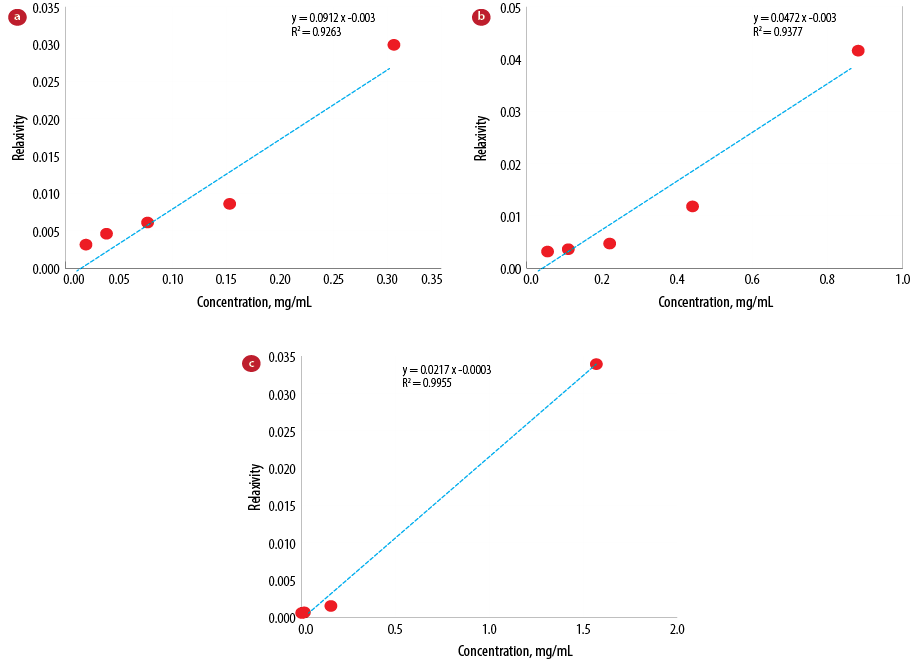
Figure 3: Relaxivity curves of (a) Gdn3+@CNTs-PEG, (b) Gd-CNT, and (c) Gadovist®.
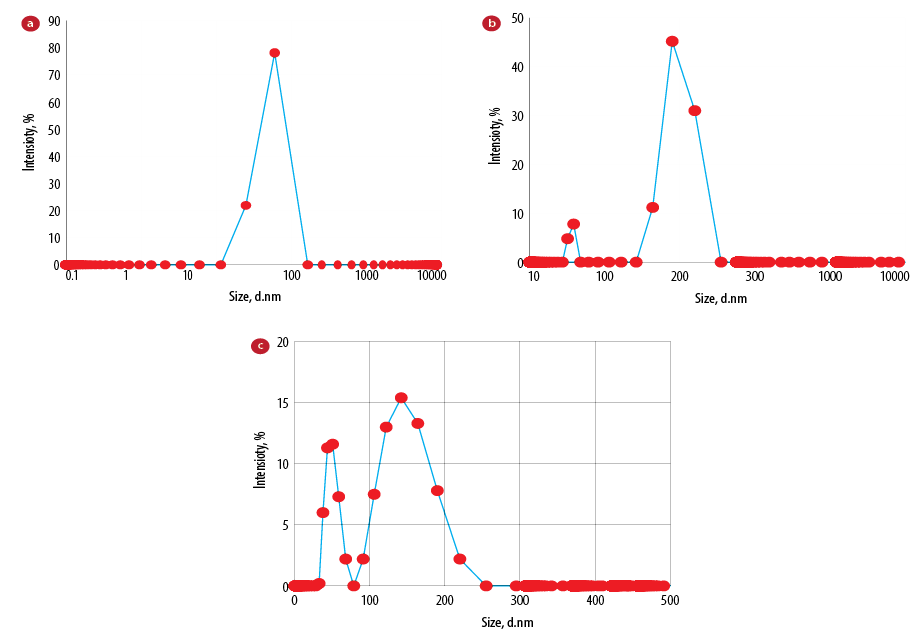
Figure 4: DLS results of (a) Gd-CNT, (b) Gdn3+@CNTs-PEG, and (c) filtered- Gdn3+@CNTs-PEG.
The size of particles was identified by DLS and TEM and are shown in Figure 4 and Figure 5, respectively. Results of ICP analysis revealed that the Gdn3+ content of Gdn3+-CNTs and Gdn3+@CNTs-PEG is 2.1% and 0.031% (w/w), respectively, and no free Gd ion was detected in the sample eventually. MRI of the vials obtained using a 1.5T MR scanner (GE, Healthcare, USA) and a standard quadknee® coil [Figure 6].
Figure 2 demonstrates the signal intensity of Gadovist® and Gdn3+@CNTs-PEG with the same protocol and a similar percentage concentrations (100%, 50.0%, 25.0%, 12.5%, and 6.3%).
After analyzing images obtained from each vial, the signal intensity was plotted versus Gd concentration [Figure 7].
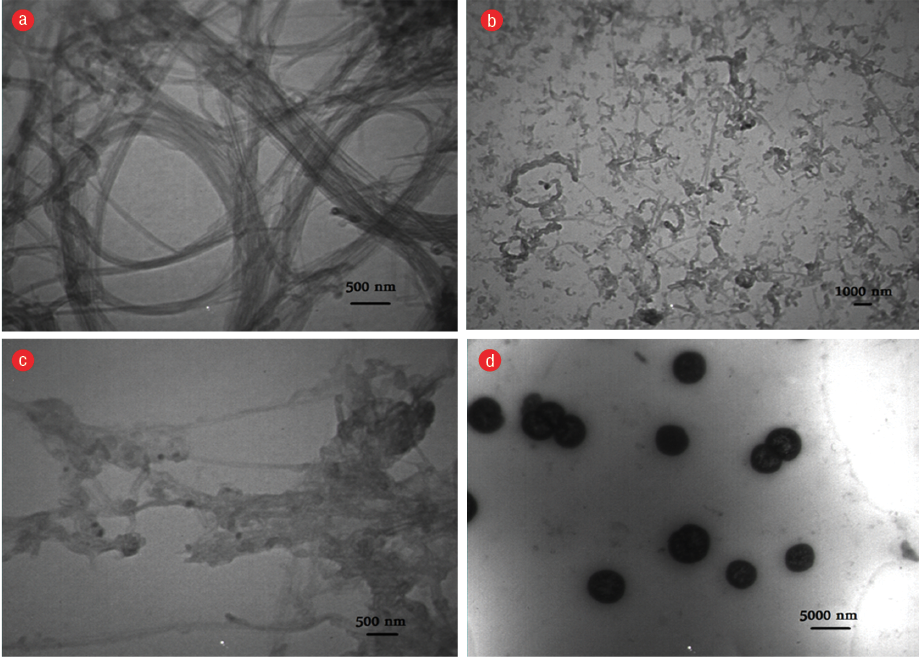
Figure 5: Transmission electron microscopy images of (a) raw CNT, (b) oxidized CNT, (c) Gd-CNT, and (d) Gdn3+@CNTs-PEG.
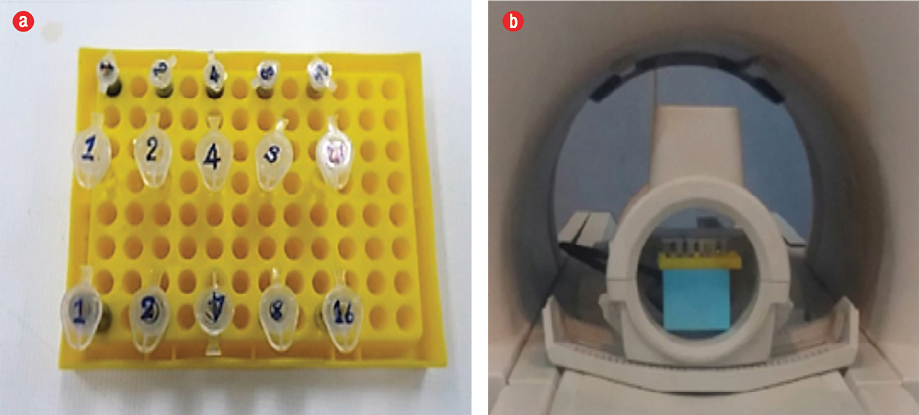
Figure 6: (a) Vials and (b) magnetic resonance imaging scanner.
Discussion
We oxidized SWCNT in harsh acidic conditions and loaded them with Gdn3+. Oxidization was performed with a mixture of nitric and sulfuric acid (1:3). This procedure removes any impurity (metal catalysts) and produces open end terminals in the structure and sidewall defects stabilized by –COOH and –OH groups.26–28 These hydrophilic holes are appropriate for accumulating Gd3+ (hydrophilic metallic ions) at the surface or inner side of the CNT28–30; besides, the –COOH group might be coupled to biochemical or chemical groups.28,30,31 CNTs have a rigid structure and are insoluble in any solvents, and solubilization of CNT with chemical functionalization has been studied briefly.12,27,32,33 Among hydrophilic polymers, PEG is attractive for use with CNT as it is biocompatible, non-toxic, stable, and low immunogenicity.12,31,33,34 Gdn3+-CNT was functionalized using PEG-1500N (Gdn3+-CNT-PEG). The attachment of PEG with Gdn3+-CNT was performed via a thermal reaction and zwitterion interaction between oxidized CNT carboxylic groups and terminated amines in PEG.31 The Gdn3+-CNT-PEG solution had more stability than Gdn3+-CNT in phosphate buffered saline. The Gdn3+-CNT-PEG remained homogeneous in an observation time of two months while in the Gdn3+-CNT black precipitation was observed after a few days. In oxidized SWCNT, a weight loss was observed at 470 °C, which might be due to thermally unstable functional groups (e.g., –OH and COOH on SWCNT) formed during oxidation. These findings show that PEG chains have successfully covered the SWCNT surfaces.35
Gd chelates shorten T1 relaxation times and therefore lead to higher signal intensity on T1-W images. In fact, beyond a certain concentration (depending on pulse sequence), the signal intensity starts to decrease with increased Gd concentration. The main reason for the unexpected relationship between Gd concentration and MRI signal intensity is that Gd contrast agents shorten not only T1 but also T2 relaxation times. At high concentrations of Gd chelate, T2 shortening is substantial enough to cause signal loss, overcoming the effect of T1 shortening.36 At low concentrations where T1 effects dominate, the signal intensity increases nonlinearly with concentration. However, above a certain concentration (depending on the characteristics of the pulse sequence), the T2 effects become more important and lead to signal loss.36
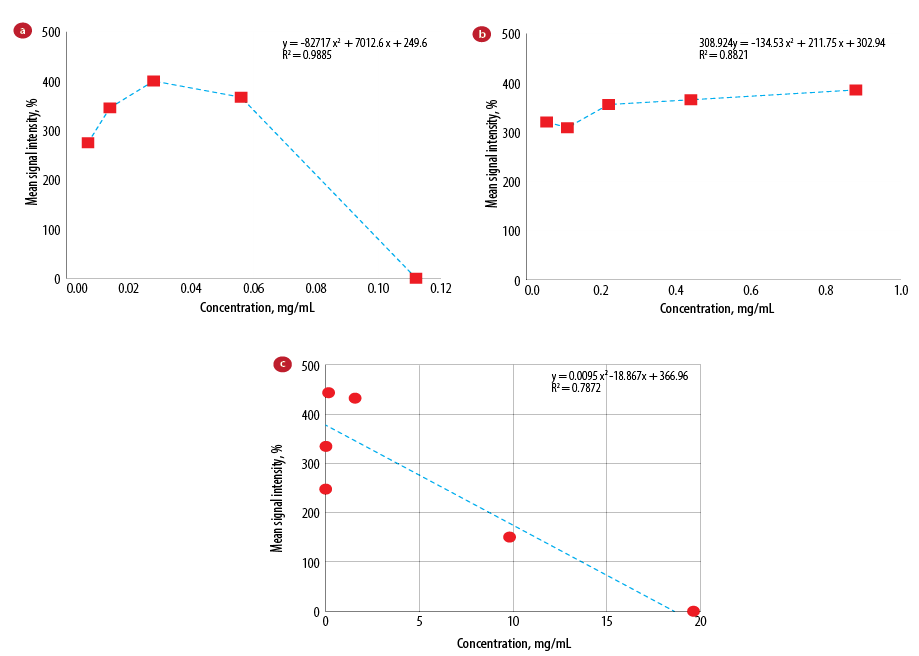
Figure 7: Mean signal intensity versus concentration for (a) Gdn3+@CNTs-PEG, (b) Gd-CNT, and (c) Gadovist®.
According to the findings, increasing the concentrations of Gd in contrast agent results to increased signal intensity in T1-W images; but above a certain Gd concentration, the reverse phenomena (signal reduction) is observed. Gadovist® was diluted as recommended by the company,37 and was poured into the vials as for Gdn3+@CNTs-PEG and Gd-CNT for imaging phase. Comparing the obtained T1-W images from different vials at considered concentrations, we observed that the signal intensity of the Gdn3+@CNTs-PEG with Gd concentration of 0.01 mg/mL was comparable with the Gadovist® with a concentration of 0.01 mg/mL.
However, Gd concentration in Gadovist® was 12.2% higher than Gdn3+@CNTs-PEG, but the signal intensity of the Gdn3+@CNTs-PEG was approximately 3.3% times greater than Gadovist®. It suggests a potentially higher imaging ability in Gdn3+@CNTs-PEG than Gadovist® at the same Gd concentration, which could increase the sensitivity of MRI and early diagnosis of tumors. Our findings are in agreement with another study that showed a better imaging potential in Gdn3+@CNTs-PEG compared to Magnevist® (another Gd-based contrast agent). The synthesized Gdn3+@CNTs-PEG led to a much higher contrast and better image quality.35
The most important criteria for optimization diagnostic efficacy and patient safety are relaxivity and stability of contrast agents.38
The first contrast agent approved for in vivo usage was Gd-DTPA (Magnevist®), which is still among the most frequently used contrast agents.39 Relaxivity of Gadovist® and Magnevist® are 5.2 and 4.1 L/mmol/s at 1.5 Tesla scanner (r1 in plasma at 37 °C), respectively.40 There are two structural classes of Gd chelate complexes: macrocyclic and linear. Macrocyclic structures impart added strength compared to a linear structure. Gadovist® and Magnevist® have a macrocyclic structure and linear structure, respectively.40 The higher signal seen with higher-relaxivity agents affords the potential for contrast agents to be used at lower doses in patients at risk of developing NSF.4,41–46 Besides, stability is an important consideration because the Gd3+ is toxic and the ability of a ligand to bind tightly to the Gd ion is an important safety consideration.47
The authors of another study concluded that Gd3+n-US-tube species are linear super paramagnetic molecular magnets with MRI efficacies 40–90 times higher than any current Gd3+-based contrast agent in clinical usage.8 The results of this study and ours are not exactly comparable as they used Magnevist® while we used Gadovist®, but the efficacy of our synthesized Gdn3+@CNTs-PEG was better than Gadovist®. Nevertheless, it seems that gadonanotube can be used as a new high-performance MRI contrast agent and, compared to other commercial gadolinium-based contrast agents, is safe and produce higher signal intensity.
Conclusion
Superparamagnetic Gdn3+@CNTs-PEG displayed highly significant MRI positive contrast enhancement. In vitro MRI studies showed that gadonanotube enhanced signal intensity in T1-W images, therefore suggesting the potential application as MRI contrast agents. The amount of Gd chelates loaded on nanotubes is much lower than commercial contrast agents, but the relaxivity of Gd-CNT is higher and, as a result, we observed an enhancement of signal intensity in T1-W images. Although the Gd concentration in Gadovist® is higher the signal intensity of the Gdn3+@CNTs-PEG was approximately 3.3% times greater. As there is a difference of Gd ion concentrations in Gadovist® and synthesized Gdn3+@CNTs-PEG, we were unable to use same concentrations of the Gd ion in the two contrast agents, and we used different dilations to get the optimized image. Further studies are needed to compare the bio-distribution and kinetics of such complexes in vivo.
Disclosure
The authors declared no conflicts of interest. No funding was received for this work.
references
- 1. Schroeder T. Imaging stem-cell-driven regeneration in mammals. Nature 2008 May;453(7193):345-351.
- 2. Herschman HR. Molecular imaging: looking at problems, seeing solutions. Science 2003 Oct;302(5645):605-608.
- 3. Geraldes CF, Laurent S. Classification and basic properties of contrast agents for magnetic resonance imaging. Contrast Media Mol Imaging 2009 Jan-Feb;4(1):1-23.
- 4. Al Faraj A, Cieslar K, Lacroix G, Gaillard S, Canet-Soulas E, Crémillieux Y. In vivo imaging of carbon nanotube biodistribution using magnetic resonance imaging. Nano Lett 2009 Mar;9(3):1023-1027.
- 5. Park JY, Baek MJ, Choi ES, Woo S, Kim JH, Kim TJ, et al. Paramagnetic ultrasmall gadolinium oxide nanoparticles as advanced T1 MRI contrast agent: account for large longitudinal relaxivity, optimal particle diameter, and in vivo T1 MR images. ACS Nano 2009 Nov;3(11):3663-3669.
- 6. Xu Q, Zhu L, Yu M, Feng F, An L, Xing C, et al. Gadolinium (III) chelated conjugated polymer as a potential MRI contrast agent. Polymer (Guildf) 2010;51(6):1336-1340 .
- 7. Sitharaman B, Kissell KR, Hartman KB, Tran LA, Baikalov A, Rusakova I, et al. Superparamagnetic gadonanotubes are high-performance MRI contrast agents. Chem Commun (Camb) 2005 Aug;(31):3915-3917.
- 8. Richard C, Doan B-T, Beloeil J-C, Bessodes M, Tóth E, Scherman D. Noncovalent functionalization of carbon nanotubes with amphiphilic Gd3+ chelates: toward powerful T1 and T2 MRI contrast agents. Nano Lett 2008 Jan;8(1):232-236.
- 9. Sitharaman B, Wilson LJ. Gadonanotubes as new high-performance MRI contrast agents. Int J Nanomedicine 2006;1(3):291-295.
- 10. Hartman KB, Laus S, Bolskar RD, Muthupillai R, Helm L, Toth E, et al. Gadonanotubes as ultrasensitive pH-smart probes for magnetic resonance imaging. Nano Lett 2008 Feb;8(2):415-419.
- 11. Lacerda L, Bianco A, Prato M, Kostarelos K. Carbon nanotubes as nanomedicines: from toxicology to pharmacology. Adv Drug Deliv Rev 2006 Dec;58(14):1460-1470.
- 12. Liu Z, Tabakman S, Welsher K, Dai H. Carbon nanotubes in biology and medicine: in vitro and in vivo detection, imaging and drug delivery. Nano Res 2009 Feb;2(2):85-120.
- 13. Hou L, Yang X, Ren J, Wang Y, Zhang H, Feng Q, et al. A novel redox-sensitive system based on single-walled carbon nanotubes for chemo-photothermal therapy and magnetic resonance imaging. Int J Nanomedicine 2016 Feb;11:607-624.
- 14. Hou L, Zhang H, Wang Y, Wang L, Yang X, Zhang Z. Hyaluronic acid-functionalized single-walled carbon nanotubes as tumor-targeting MRI contrast agent. Int J Nanomedicine 2015 Jul;10:4507-4520.
- 15. Yan C, Chen C, Hou L, Zhang H, Che Y, Qi Y, et al. Single-walled carbon nanotube-loaded doxorubicin and Gd-DTPA for targeted drug delivery and magnetic resonance imaging. J Drug Target 2017 Feb;25(2):163-171.
- 16. Bethune DS, Kiang CH, de Vries MS, Gorman G, Savoy R, Vazquez J, et al. Cobalt-catalysed growth of carbon nanotubes with single-atomic-layer walls. Nature 1993;363:605-607.
- 17. Iijima S. Helical microtubules of graphitic carbon. Nature 1991;354(6348):56-58.
- 18. Ashcroft JM, Hartman KB, Mackeyev Y, Hofmann C, Pheasant S, Alemany LB, et al. Functionalization of individual ultra-short single-walled carbon nanotubes. Nanotechnology 2006;17(20):5033-5037.
- 19. Chen J, Chen S, Zhao X, Kuznetsova LV, Wong SS, Ojima I. Functionalized single-walled carbon nanotubes as rationally designed vehicles for tumor-targeted drug delivery. J Am Chem Soc 2008 Dec;130(49):16778-16785.
- 20. Shi Kam NW, Jessop TC, Wender PA, Dai H. Nanotube molecular transporters: internalization of carbon nanotube-protein conjugates into Mammalian cells. J Am Chem Soc 2004 Jun;126(22):6850-6851.
- 21. Bianco A, Kostarelos K, Prato M. Applications of carbon nanotubes in drug delivery. Curr Opin Chem Biol 2005 Dec;9(6):674-679.
- 22. Liu Z, Chen K, Davis C, Sherlock S, Cao Q, Chen X, et al. Drug delivery with carbon nanotubes for in vivo cancer treatment. Cancer Res 2008 Aug;68(16):6652-6660.
- 23. McDevitt MR, Chattopadhyay D, Kappel BJ, Jaggi JS, Schiffman SR, Antczak C, et al. Tumor targeting with antibody-functionalized, radiolabeled carbon nanotubes. J Nucl Med 2007 Jul;48(7):1180-1189.
- 24. Tsang S, Chen Y, Harris P, Green M. A simple chemical method of opening and filling carbon nanotubes. Nature 1994;372(6502):159-162 .
- 25. Tang J, Sheng Y, Hu H, Shen Y. Macromolecular MRI contrast agents: Structures, properties and applications. Prog Polym Sci 2013;38(3):462-502 .
- 26. Firme CP III, Bandaru PR. Toxicity issues in the application of carbon nanotubes to biological systems. Nanomedicine 2010 Apr;6(2):245-256.
- 27. Klumpp C, Kostarelos K, Prato M, Bianco A. Functionalized carbon nanotubes as emerging nanovectors for the delivery of therapeutics. Biochim Biophys Acta 2006 Mar;1758(3):404-412.
- 28. CAI SY. KONG J-L. Advance in research on carbon nanotubes as diagnostic and therapeutic agents for tumor. Chin J Anal Chem 2009;37(8):1240-1246 .
- 29. Kostarelos K, Bianco A, Prato M. Promises, facts and challenges for carbon nanotubes in imaging and therapeutics. Nat Nanotechnol 2009 Oct;4(10):627-633.
- 30. Hashimoto A, Yorimitsu H, Ajima K, Suenaga K, Isobe H, Miyawaki J, et al. Selective deposition of a gadolinium(III) cluster in a hole opening of single-wall carbon nanohorn. Proc Natl Acad Sci U S A 2004 Jun;101(23):8527-8530.
- 31. Huang W, Fernando S, Allard LF, Sun Y-P. Solubilization of single-walled carbon nanotubes with diamine-terminated oligomeric poly (ethylene glycol) in different functionalization reactions. Nano Lett 2003;3(4):565-568.
- 32. Kam NW, O’Connell M, Wisdom JA, Dai H. Carbon nanotubes as multifunctional biological transporters and near-infrared agents for selective cancer cell destruction. Proc Natl Acad Sci U S A 2005 Aug;102(33):11600-11605.
- 33. Foldvari M, Bagonluri M. Carbon nanotubes as functional excipients for nanomedicines: II. Drug delivery and biocompatibility issues. Nanomedicine 2008 Sep;4(3):183-200.
- 34. Yang ST, Fernando KA, Liu JH, Wang J, Sun HF, Liu Y, et al. Covalently PEGylated carbon nanotubes with stealth character in vivo. Small 2008 Jul;4(7):940-944.
- 35. Jahanbakhsh R, Atyabi F, Shanehsazzadeh S, Sobhani Z, Adeli M, Dinarvand R. Modified Gadonanotubes as a promising novel MRI contrasting agent. Daru 2013 Jul;21(1):53.
- 36. Lee VS. Cardiovascular MRI: physical principles to practical protocols. Philadelphia, PA: Lippincott Williams & Wilkins; 2006. p. 402.
- 37. Lee L. Volume of blood in a human. The Physics Factbook. 1998.
- 38. Tweedle MF, Kanal E, Muller R. Considerations in the selection of a new gadolinium-based contrast agent. Appl Radiol 2014;43(5)(Suppl):1-11.
- 39. Laurent S, Elst LV, Copoix F, Muller RN. Stability of MRI paramagnetic contrast media: a proton relaxometric protocol for transmetallation assessment. Invest Radiol 2001 Feb;36(2):115-122.
- 40. Gadovist 1.0mmol/ml solution for injection. Bayer plc, Berkshire, England.
- 41. Pediconi F, Fraioli F, Catalano C, Napoli A, Danti M, Francone M, et al. Gadobenate dimeglumine (Gd-DTPA) vs gadopentetate dimeglumine (Gd-BOPTA) for contrast-enhanced magnetic resonance angiography (MRA): improvement in intravascular signal intensity and contrast to noise ratio. Radiol Med 2003 Jul-Aug;106(1-2):87-93.
- 42. Prokop M, Schneider G, Vanzulli A, Goyen M, Ruehm SG, Douek P, et al. Contrast-enhanced MR Angiography of the renal arteries: blinded multicenter crossover comparison of gadobenate dimeglumine and gadopentetate dimeglumine. Radiology 2005 Feb;234(2):399-408.
- 43. Achenbach M, Figiel JH, Burbelko M, Heverhagen JT. Prospective comparison of image quality and diagnostic accuracy of 0.5 molar gadobenate dimeglumine and 1.0 molar gadobutrol in contrast-enhanced run-off magnetic resonance angiography of the lower extremities. J Magn Reson Imaging 2010 Nov;32(5):1166-1171.
- 44. Woodard PK, Chenevert TL, Sostman HD, Jablonski KA, Stein PD, Goodman LR, et al. Signal quality of single dose gadobenate dimeglumine pulmonary MRA examinations exceeds quality of MRA performed with double dose gadopentetate dimeglumine. Int J Cardiovasc Imaging 2012 Feb;28(2):295-301.
- 45. Li Y, Li X, Li D, Lu J, Xing X, Yan F, et al. Multicenter, intraindividual comparison of single-dose gadobenate dimeglumine and double-dose gadopentetate dimeglumine for MR angiography of the supra-aortic arteries (the Supra-Aortic VALUE study). AJNR Am J Neuroradiol 2013 Apr;34(4):847-854.
- 46. Wang J, Yan F, Liu J, Lu J, Li D, Luan J, et al. Multicenter, intra-individual comparison of single dose gadobenate dimeglumine and double dose gadopentetate dimeglumine for MR angiography of the peripheral arteries (the Peripheral VALUE Study). J Magn Reson Imaging 2013 Oct;38(4):926-937.
- 47. Tweedle MF. The ProHance story: the making of a novel MRI contrast agent. Eur Radiol 1997;7(5)(Suppl 5):225-230.