Studies on patient satisfaction started in the 1950s and continue to date. Nowadays, patient satisfaction is one of the most important performance and quality outcome indicators for healthcare delivery services.1,2 Patient satisfaction refers to a patient assessment of the services received from the healthcare provider, which is affected by both the levels of expectation and experience of a customer.3 With patient feedback, the quality of health services can be evaluated and monitored. Patient satisfaction can be influenced by past experience, lifestyle, individual value, and level of knowledge. Average lengthy waiting time, employee attitude and work process, heavy workload adequate faciities are issues highlighted in public healthcare services.4 Patient satisfaction can also be influenced by the individual level of expectation on the provided services, which depend on the person’s knowledge of the standard operating procedure of the services.5
Satisfaction level can be evaluated using the SERVQUAL (SERV-service, QUAL-quality) instrument. This instrument was widely used in patient satisfaction studies and has been found appropriate in healthcare settings with some modification to suit the specific environment.3,6,7 The satisfaction level is determined by analyzing the service quality (SQ) gap, which is the difference between customer expectation and their perception. SQ is related to consumer’s expectations before and during acquiring services and its perceived quality following the service.8 Positive SQ gap for any dimension in the SERVQUAL instrument indicates a customer was satisfied and their expectation was met on that dimension. Meanwhile, the negative SQ gap indicates dissatisfaction where the service has not been completely fulfilled.8 The five SERVQUAL dimensions are: (1) tangible: the appearance of physical facilities, equipment, and appearance of healthcare personnel, (2) reliability: the ability to perform the promised services dependently and accurately, (3) responsiveness: the willingness to help the customer and provide prompt service, (4) assurance: the knowledge and courtesy of employee and their ability to inspire trust and confidence, (5) empathy: the level of caring and attention given to the customer.
1 Malaysia Clinic (1MC) is the latest innovation in public primary healthcare services in Malaysia. It was established in 2010 by the Prime Minister, Dato’ Seri Mohd Najib Tun Abd Razak, in line with the “1 Malaysia” concept, which is “People First, Performance Now”. The aim was to increase the accessibility and equitability for the poor, urban population. This is because in Malaysia almost 60% of primary care services are concentrated in rural areas.9 A few strategies were used to achieve the objective. First, the location of the clinics were chosen with a focus on areas with a concentrated, dense urban population.9 Secondly, the operational time for the clinic was 10 am to 10 pm, which was beyond the normal office hours and gave patients the option to receive services at night. These innovations helped increase accessibility of healthcare services to those in need.
Kota Bharu serves as a state capital of Kelantan. It is in the northeastern part of Peninsular Malaysia and close to the border of Thailand. The land area for Kota Bharu district is about 409 km/m2 and includes 15 subdistricts. The total population of Kota Bharu in 2015 was about 564 400 people making up 33% of the total Kelantan population. Almost all the Kota Bharu population were ethnic Malays (94.4%) with the remainder Chinese and others. The Kota Bharu District Health Office provided public healthcare services in Kota Bharu under the Kelantan State Health Department. Until 31 December 2016, there were 17 public health clinics, 25 community clinics, and nine 1MCs located in Kota Bharu, Malaysia.
The objective of our study was to determine the level of patient satisfaction and its associated factors among patients attending 1MCs in Kota Bharu. Our study also aimed to identify the most critical SERVQUAL dimension in the implementation of 1MC. There have been little studies done to evaluate the level of satisfaction of 1MC since its implementation in 2010. Hence, it was important to obtain more knowledge about the level of satisfaction and its associated factors, which later can help improve the quality of 1MC services.
Methods
We used a cross-sectional study design using primary data from a survey conducted for 18 days, which started in the third week of January until the second week of February 2017 in all nine 1MCs in Kota Bharu. The nine 1MCs located around Kota Bahru city included 1MC Sri Cemerlang, 1MC Panji, 1MC Pasir Tumbuh, 1MC Pengkalan Chepa, 1MC RTC Tunjung, 1MC Lembah Sireh, 1MC Langgar, 1MC UTC, and 1MC Lubok Pukol. Most of these clinics are located only in six out of 15 subdistricts include Kota Bharu, Kota, Panji, Pengkalan Chepa, Kubang Kerian, and Pendek. The average daily patient attendance to a 1MC in Kota Bharu ranged from 50 to 150 patients according to 2016 data.
A sample size of 358 was calculated using a single proportion formula based on the study done by John et al.10 After adding a 20% drop rate, the estimated sample size was 430. This meant that 57% of average daily patient attendances were needed from each clinic. Simple random sampling was applied to select the respondents at the registration counter according to the inclusion criteria. Inclusion criteria for the study sample were Malaysian citizens aged 18 years old and above. Related patients, patients in an emergency condition, or those with a history of psychiatric problems were excluded.
Our study used the validated SERVQUAL questionnaire from the Ministry of Health, Malaysia. The Cronbach’s alpha reliability was between 0.63 and 0.89 for expectation, and between 0.69 and 0.92 for perception.10 This questionnaire applied a five-point Likert scale that ranges from 1 = Strongly disagree, 2 = Disagree, 3 = Uncertain, 4 = Agree, and 5 = Strongly agree. The questionnaire assessed patients’ agreement on five SQ dimensions based on their expectation (before meeting the provider) and perception (after meeting the provider). The first section of the questionnaire was the demographic characteristics of the respondents. The second and third section contained 20 matching statements for expectation and perception, respectively. The difference between the SQ expectation and perception score was called the SQ gap score. The mean SQ gap score for all 20 matched items determine the level of satisfaction, which was further categorized into ‘satisfied’ if mean the SQ gap score was zero (0) or more, and ‘not satisfied’ if score was less than zero (0).
Data entry and analysis was carried out using SPSS Statistics (IBM Corp. Released 2013. IBM SPSS Statistics for Windows, Version 22.0. Armonk, NY: IBM Corp). The sociodemographic characteristics were tabulated for descriptive statistics. Paired t-test was used to compare a significant difference in the mean score between expectation and perception of SERVQUAL dimensions to identify those with the largest SQ gap, which indicated the most critical dimension. Multiple logistic regression was used to identify the most significant associated factor, which can influence the level of satisfaction.
Our study was approved by the Human Research Ethical Committee Universiti Sains Malaysia (USM/JEPeM/17010019) and Medical Research and Ethics Committee of National Medical Research Registry (NMRR), Ministry of Health, Malaysia (NMRR No 19-2431-33661).
Results
A total of 386 respondents participated in this study. Respondents sociodemographic characteristic studied were age, sex, race, marital status, education status, monthly household income, occupation, and frequency of visit [Table 1]. A prominent feature of the respondent characteristics was that the majority were less than 60 years old (94.0%), and most had a monthly household income of RM 3000 and less (72.5%). Most respondents were married (65.8%). Although nearly all respondents had a formal education, only a quarter had tertiary education. The ethnic distribution in this study was not representative of the country as almost all the respondents were Malay.
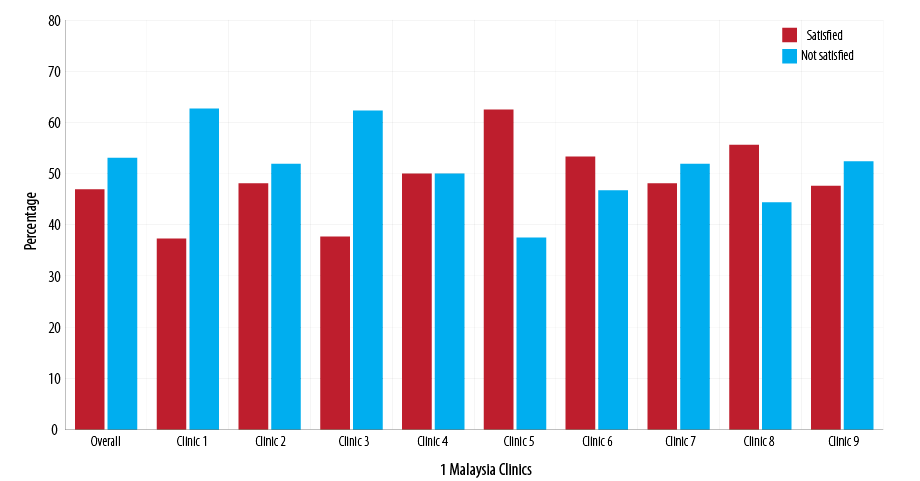
Figure 1: The level of patient satisfaction according to each 1 Malaysia Clinic in the Kota Bharu District, Malaysia.
The level of satisfaction was determined by analyzing the mean SQ gap from all 20 matched items, which revealed only less than half of respondents were satisfied with 1MC services compared to 53.1% who were not satisfied. Only three clinics had more than half of the respondents satisfied with the services, and these clinics were relatively new clinics compared to the other six. Figure 1 showed the level of patient satisfaction according to each 1MC.
Table 1: Sociodemographic characteristic among respondents (N = 386).
|
Age, years |
|
37.3 ± 13.5 |
|
< 60 |
363 (94.0) |
|
|
> 60 |
23 (6.0) |
|
|
Sex |
|
|
|
Male |
184 (47.7) |
|
|
Female |
202 (52.3) |
|
|
Race |
|
|
|
Malay |
370 (95.9) |
|
|
Others |
16 (4.1) |
|
|
Marital status |
|
|
|
Single |
110 (28.5) |
|
|
Married |
254 (65.8) |
|
|
Divorce |
22 (5.7) |
|
|
Education status |
|
|
|
No formal education |
5 (1.3) |
|
|
Primary school |
16 (4.1) |
|
|
Secondary school |
241 (62.4) |
|
|
Diploma/degree |
124 (32.1) |
|
|
Household income |
|
|
|
≥ RM 3000 |
280 (72.5) |
|
|
< RM 3000 |
106 (27.5) |
|
|
Occupation |
|
|
|
Government |
45 (11.7) |
|
|
Private or self-employed |
189 (49.0) |
|
|
Unemployed |
152 (39.4) |
|
|
Frequency of visit |
|
|
|
1 |
92 (23.8) |
|
|
2 |
57 (14.8) |
|
Table 2: The difference in mean score between patient expectation and perception (SQ gap) based on SERVQUAL dimensions (N = 386).
|
Tangible |
4.44 ± 0.44 |
4.19 ± 0.53 |
-0.25 (-0.30, -0.19) |
-9.14 |
< 0.001 |
|
Reliable |
4.49 ± 0.44 |
4.36 ± 0.51 |
-0.13 (-0.18, -0.08) |
- 4.93 |
< 0.001 |
|
Responsiveness |
4.48 ± 0.46 |
4.35 ± 0.50 |
-0.13 (-0.18, -0.07) |
- 4.87 |
< 0.001 |
|
Assurance |
4.50 ± 0.46 |
4.32 ± 0.49 |
-0.18 (-0.23, -0.13) |
- 4.87 |
< 0.001 |
aSQ: service quality; SERVQUAL: SERV-service, QUAL- quality; SD: standard deviation; CI: confidence interval.
There was a statistically negative significant difference between the expectation of the patients compared with their perception on all the SERVQUAL dimensions (p < 0.010) indicating that all SERVQUAL dimensions did not meet their expectation.
This study showed the empathy dimension carried the highest mean score for level of expectation and perception (4.56 and 4.40, respectively). The most critical was the tangible dimension, which had the largest SQ gap. The smallest SQ gap was observed in the reliability (-0.13) and responsiveness (-0.13) dimensions [Table 2].
Multiple logistic regression analysis showed only three factors associated with the level of satisfaction in this study: low education level, a household income of RM 3000 and less, and three or more clinic visits. Table 3 showed the most significant factors influence the level of satisfaction using multiple logistic regression analysis.
Table 3: Factors associated with the level of patient satisfaction using multiple logistic regression analysis
(N = 386).
|
Education level |
|
|
|
|
|
High education level |
1 |
1 |
|
|
|
Low education level |
1.89 (1.22, 2.94) |
1.87 (1.06, 2.67) |
4.97 |
0.024 |
|
Income level |
|
|
|
|
|
> RM 3000 |
1 |
1 |
|
|
|
≤ RM 3000 |
3.21 (1.88, 5.48) |
2.97 (1.72, 5.51) |
15.08 |
< 0.001 |
|
Frequency of visit |
|
|
|
|
|
< 3 |
1 |
1 |
|
|
a: simple logistic regression; b: multiple logistic regression; CI: confidence interval; OR: odds ratio; Constant = -1.851
Forward logistic regression and backward logistic regression method was applied.
No multicollinearity and no interaction.
Hosmer Lemeshow test, p-value = 0.797.
Classification table 63% correctly classified.
Area under receiver operating characteristics curve was 67.5%.
Discussion
Previous studies have been conducted on patient satisfaction at 1MCs in Rawang, Selangor only covering a small number of clinics.11,12 Our study covered all nine 1MCs for the whole Kota Bharu district in Malaysia. However, our study, performed in Kelantan, is dominated by Malay population, which might give a different views on its findings and may not be inferred to the whole population of Malaysia. The response rate in this study exceeded the minimum sample size required which was 358 where the actual respondents was 368. Our study complied with the need of a minimum 80% response rate for the result to be representative and able to answer the research objective.13
Our study revealed that less than half of the respondents were satisfied with the service provided by 1MCs. This might be because the clinics were still newly implemented and some issues arose during the implementation, which can affect satisfaction.14 However, three clinics that had more than half of the respondents satisfied with the service. This might be because those clinics were relatively new and were properly equipped with better facilities.
The level of satisfaction in our study was considered higher compared to a study done in Public Health Clinic in Hulu Langat District, Selangor15 where only 27.5% of patients were satisfied. This study also used the SERVQUAL instrument. A similar low-level satisfaction was reported in another study, which used a similar questionnaire in dental health care facilities in Kelantan in which only 37% of patients were satisfied with the services.10 The variation in level of satisfaction could be because of the differences in the healthcare settings, which provide different services and may lead to a different level of expectation and perception towards the services. Most of the time, the services provided by each institution are heterogeneous; they can differ from day to day, place to place, producer to producer, and customer to customer.8 Even with the similar healthcare setting and services, the level of satisfaction may differ from one person to another and the time they received the services.
Previous studies suggest that the level of patient satisfaction might be higher if the assessment was based on overall satisfaction. These studies revealed high satisfaction (up to 90%) based on overall perception but dropped when using the SERVQUAL instrument at the same time in the same respondents.10,16 Assessment of satisfaction level using the SERVQUAL instrument gave a close approximation to the true value of a patient’s degree of satisfaction as this method is more valid and reliable compared to a single question on overall perception.3,17 However, assessment of satisfaction level using the gap between patient expectation and perception should be interpreted with caution because of the influence of other factors such as the expectation need to be rational.18
The patients’ expectations of services provided were higher than their perceptions for all SERVQUAL dimensions. The SQ gap for all dimensions was negative, and this finding was expected using the SERVQUAL instrument as shown by other studies.10,15,19,20 The tangible dimension was identified as the most critical dimension in need of improvement, which was similar to previous studies.7,15 As suggested by Chowdhary and Prakash,21 the respondents in our study may need more tangible factors to identify a quality service such as the physical appearance of the premises, which in our case are rental shophouse lots. It is difficult to adjust the physical structure of the clinic when the building is already fixed and permanently built. Besides, the patient might misunderstand the scope of implementation of 1MC, which was more focus to provide basic health services.9 Patients may have expected and presumed that all facilities and equipment for advanced treatment would be available, but their perception was different when they found that the clinic provides only basic health care services and lack laboratory facilities and the latest equipment found in hospitals or other health clinics.
Contrary to other studies,20,22 in our study, the most satisfied SERVQUAL dimension was reliability and responsiveness as both dimensions had the smallest SQ gap. This means that patients attending 1MCs in Kota Bharu were at least satisfied with the ability of the clinic to perform the promised services dependently and accurately, also willing to help patients and provide prompt service. The other two dimensions (empathy and assurance) also had negative SQ gap meaning that the service in 1MC did not meet their expectations.
Most of the studies in the literature review examined the association between demographic factors and patient satisfaction; however, the findings from these studies are conflicting.2 These demographic factors can be considered for fair adjustment in patient satisfaction studies; hence, it can be utilized in benchmarking with other healthcare institutions.23 In this study, only three sociodemographic factors were significantly associated with the level of patient satisfaction among patients attending 1MC, which were education level, income level, and frequency of clinic visits.
Like our study, many local10,15,24 and international22,25 studies revealed a significant association between low education level and higher satisfaction. The possible reason for this finding could be due to patients with higher education levels having higher expectations as they claimed to be more knowledgeable about the services they should receive. When certain prominent elements were not fulfilled, these gave bad remark and led to poor judgment in the satisfaction level22 in which they easily expressed their dissatisfaction.26 Furthermore, to a certain extent those with higher level of education are more critical and able to see the services objectively, and if the service did not meet the evaluation it caused dissatisfaction.10
Low income was a significant factor to determine satisfaction level.19,24 The low-income group were more concerned with the cost of the services and were easily satisfied with the services provided at lost cost.5 The low-income group in this study more satisfied with 1MC services possibly because of the factors that encourage them to go to 1MCs instead of private practitioners, which are more expensive. The encouraging factors are: first, its operational time outside normal working hours (until 10 pm daily and open every day except during festive holiday); second, its location in a dense population and easily accessible; and third, because government health clinic only cost about MR 1.00 (approximately USD 0.25).9
The frequency of visits to the clinic is also one of the significant factor influencing the level of satisfaction among patients at 1MC and this is consistent with other studies.16,27 This is because when patients visit frequently, they had more information about the services and were familiar with the services provided which lead to low expectation.27 With the increased frequency of visits to the clinic, patients expected more from the empathy dimension (i.e., care and attention given by the healthcare worker) as their determinant of satisfaction27 and this was consistent with finding of this study where empathy dimension got the highest expectation score.
There were some limitations to this study. The survey was conducted at one particular point of time, and it might not reflect the overall performance of the services offered by 1MC. Beside that the rating given by respondents in the questionnaire might be influenced by the individual mood at the time of the survey, past experience, mass media, and presence of the Hawthrone effect or observer effect in which might be not the true feeling about the services.
Conclusion
The establishment of 1MC is considered successful according to its objective to provide healthcare service for low-income populations in an urban area. This was shown in this study when most patients from low-income groups were more likely to be satisfied with the services. There is a lot of improvement required especially in the most critical SERVQUAL dimensions to increase the satisfaction level for 1MC. Continuous evaluation and improvement are required for the clinic to provide better quality healthcare services in an
urban setting.
Disclosure
The authors declared no conflicts of interest. No funding was received for this study.
Acknowledgements
We would like to express our deepest gratitude to Director General of Health, Malaysia for permitting us to carry out this research and publish this article. We remain indebted to Kota Bharu District Health Office for granting us permission to embark on this research. Our utmost sincere appreciation to all outpatients for giving us fullest cooperation without whom there would be no findings.
references
- 1. Zabada C, Singh S, Munchus G. The role of information technology in enhancing patient satisfaction. British Journal of Clinical Governance. 2001;6(1):9-16.
- 2. Al-Abri R, Al-Balushi A. Patient satisfaction survey as a tool towards quality improvement. Oman Med J 2014 Jan;29(1):3-7.
- 3. Chakraborty R, Majumdar A. Measuring consumer satisfaction in health care sector: the applicability of SERVQUAL. Researchers World. 2011;2(4):149.
- 4. Pillay DI, Ghazali RJ, Manaf NH, Abdullah AH, Bakar AA, Salikin F, et al. Hospital waiting time: the forgotten premise of healthcare service delivery? Int J Health Care Qual Assur 2011;24(7):506-522.
- 5. Naidu A. Factors affecting patient satisfaction and healthcare quality. Int J Health Care Qual Assur 2009;22(4):366-381.
- 6. Ladhari R. A review of twenty years of SERVQUAL research. Int J Qual Serv Sci 2009;1(2):172-198.
- 7. Fatima I, Humayun A, Anwar MI, Iftikhar A, Aslam M, Shafiq M. How do patients perceive and expect quality of surgery, diagnostics, and emergency services in tertiary care hospitals? An evidence of gap analysis from Pakistan. Oman Med J 2017 Jul;32(4):297-305.
- 8. Parasuraman A, Zeithaml VA, Berry LL. Servqual: A multiple-item scale for measuring consumer perc. J Retailing 1988;64(1):12.
- 9. Family Health Development Division MOH. 1 Malaysia Clinic Operational Manual. 2nd ed. Kuala Lumpur, Malaysia; 2016. p.64.
- 10. John J, Yatim FM, Mani SA. Measuring service quality of public dental health care facilities in Kelantan, Malaysia. Asia Pac J Public Health 2011 Sep;23(5):742-753.
- 11. Hassan H, Ahmad R, Bahari LKA. Kajian Persepsi Masyarakat Terhadap Perlaksanaan Klinik 1 Malaysia. 2011.
- 12. Yunus NaM. Latiff DSA, Din SC, Ma’on SN. Patient Satisfaction with Access to 1Malaysia Clinic. Procedia Soc Behav Sci 2013;91:395-402.
- 13. Fincham JE. Response rates and responsiveness for surveys, standards, and the Journal. Am J Pharm Educ 2008 Apr;72(2):43.
- 14. Hasan SA. 1 Malaysia clinics: intention vs reality. 2015 [cited 2016 October 15]. Available from: https://www.linkedin.com/pulse/1malaysia-clinics-intention-vs-reality-syed-adeel-hasan.
- 15. Azimatun NA, Salmiah B, Ahamad J. Kajian keratan rentas perbandingan kepuasan pelanggan di antara klinik-klinik kesihatan primer luar bandar dan bandar di daerah hulu langat dan faktor-faktor yang mempengaruhi. Malays J Public Health Med 2012;12(2):52-67.
- 16. Nasaruddin Mahdzir M, Aniza I, Faridah AR, Sulha A. Assessing the service quality of physiotherapy services: A cross sectional study at teaching hospitals in Klang Valley, Malaysia. Malays J Public Health Med 2013;13(2).
- 17. Mongkolrat S, Pongpanich S. Foreign patient customer satisfaction with private hospital service. J Health Res 2009;23(suppl):49-52.
- 18. Alrashdi I. Evaluation of quality of healthcare: to what extent can we rely on patient expectations and preferences. Oman Med J 2012 Nov;27(6):448-449.
- 19. Hayati IN, Azimatun NA, Rozita H, Ezat WS. MR A. In-patient’s satisfaction in the medical and surgical wards-A comparison between accreditted and non accreditated hospital in the state of Selangor. Jurnal Kesihatan Masyarakat. 2010;16(1):60-68.
- 20. Butt MM, de Run EC. Private healthcare quality: applying a SERVQUAL model. Int J Health Care Qual Assur 2010;23(7):658-673.
- 21. Chowdhary N, Prakash M. Prioritizing service quality dimensions. Manag Serv Qual 2007;17(5):493-509.
- 22. Al-Momani MM. Gap Analysis between Perceptions and Expectations of Medical-Surgical Patients in a Public Hospital in Saudi Arabia. Med Princ Pract 2016;25(1):79-84.
- 23. Quintana JM, González N, Bilbao A, Aizpuru F, Escobar A, Esteban C, et al. Predictors of patient satisfaction with hospital health care. BMC Health Serv Res 2006 Aug;6:102.
- 24. Ganasegeran K, Perianayagam W, Abdul Manaf R, Ali Jadoo SA, Al-Dubai SAR. Patient satisfaction in Malaysia’s busiest outpatient medical care. The Scientific World Journal 2015;2015:714754.
- 25. Bodur S, Özdemir YE, Kara F. Outpatient satisfaction with health centers in Urban Areas. Turk J Med Sci 2002;32:409-414.
- 26. Sharifa Ezat W, Jamsiah M, Malka S, Azimatun NA. Tuti Ningseh, Noor Izzah AS. Customers’ satisfaction among urban and rural public health clinics in state of Selangor, Malaysia. Malays J Public Health Med 2010;10(2):52-67.
- 27. Cho WH, Lee H, Kim C, Lee S, Choi KS. The impact of visit frequency on the relationship between service quality and outpatient satisfaction: a South Korean study. Health Serv Res 2004 Feb;39(1):13-33.