An estimated one million babies die globally annually due to prematurity, of which approximately 375 000 neonatal deaths due to prematurity and low birth weight occur in India alone.1,2 Only about half of these newborns are weighed at birth and for a proportion of them the gestational age (GA) is known.3 Conventionally, GA is computed based on Naegele’s formula or by ultrasonic evaluation. GA estimates based on Naegele’s formula tend to have lower accuracy in settings with low literacy.4 In India, one study has estimated that only 24% of pregnant women undergo ultrasonic evaluation during pregnancy.5 Reliability of the New Ballard Score (NBS) as an assessment tool to determine GA is uncertain as its accuracy depends on the skill of the examiner and the neonate’s condition.6 Therefore, an inexpensive and practical method is needed to identify at-risk preterm newborns soon after birth.7,8 Several anthropometric parameters can be determined in neonates using simple measuring instruments.
We sought to determine whether anthropometric parameters, in particular, head circumference (HC) and crown-heel length (CHL), can be measured in preterm neonates and used as a proxy measure for GA. Low maternal serum zinc, hemoglobin, and ferritin levels were found to have no effects on new born HC.9 This provides an added value to using HC as an anthropometric parameter.
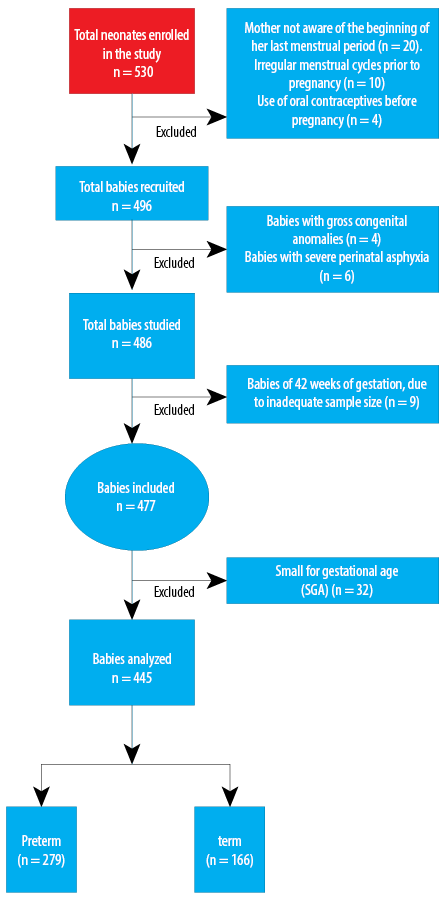
Figure 1: Flow diagram of newborn recruited for study.
Methods
This cross-sectional observational study was conducted in the neonatal unit of a tertiary care teaching hospital from March 2015 to May 2016. This unit provides intensive care to sick low birth weight neonates referred from community hospitals of Kolkata and its surrounding states. The Institutional Ethics Committee approved the study.
Five hundred and thirty consecutively selected singleton live-born babies, with a GA of 28 to 41 weeks, were included after obtaining informed written consent from the parents. Neonates for whom reliable GA information was not available were excluded. The following exclusion criteria were applied: mother unaware of the beginning of her last menstrual period (LMP); irregular menstrual cycles before pregnancy; bleeding during the first two months of pregnancy; and difference in GA calculated by LMP and NBS by > 2 weeks. Neonates with congenital anomalies like congenital talipes equinovarus, congenital vertical talus, and other congenital anomalies that hinder anthropometric measurements were excluded along with those with severe perinatal asphyxia. Small for date neonates were also excluded. Also excluded from the study were intrauterine growth restricted (IUGR) and large for gestational age neonates.
Recumbent CHL was recorded to the nearest 1.0 mm using an infantometer. HC was measured between the glabella, anteriorly and along the most prominent point posteriorly by the crossover technique, measured over the parietal eminence. This was performed thrice within 72 hours of birth and the mean value recorded. HC was measured by non-stretchable tape and recorded to the nearest 0.1 cm.
Anterior fontanel area was calculated as anterior fontanel area (in cm2) = ½ × anteroposterior length (cm) × transverse length (cm).
The GA of the study subjects was calculated from the history sheets of their mother, using Naegele’s formula,10 (i.e., addition of 9 months and 7 days to the first day of the LMP) and by NBS11 which was regarded as the gold standard for our study. CHL and HC assessment of GA by NBS was carried out by only one investigator to avoid interobserver bias.
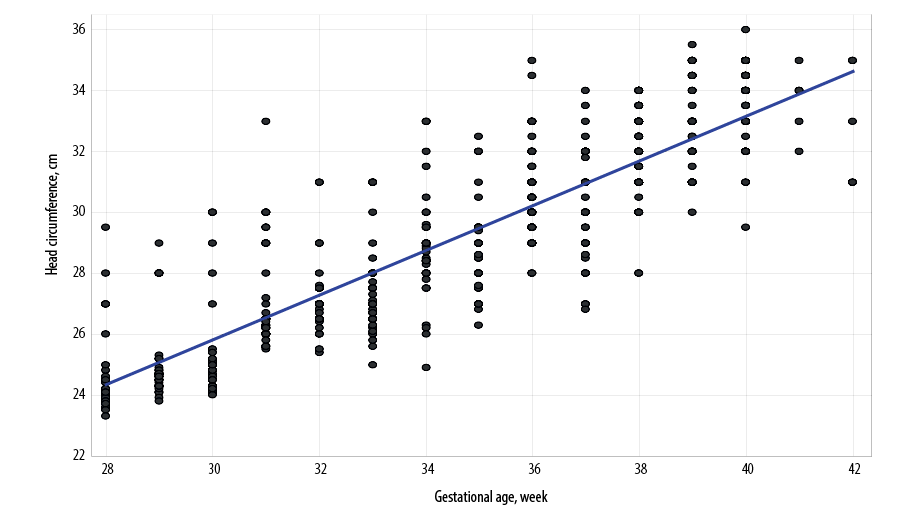
Figure 2: Correlation of head circumference with gestational age in the study cohort. Scatterplot showing association between neonatal head circumference and gestational age on the third postnatal day. The regression line is shown.
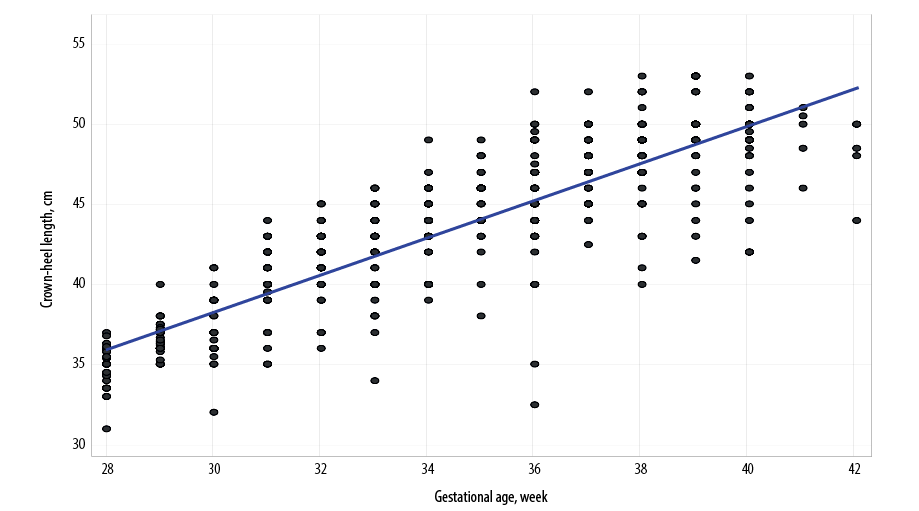
Figure 3: Scatterplot showing association between neonatal crown-heel length and gestational age on the third postnatal day. The regression line is shown.
Data were first tabulated in a Microsoft Excel spreadsheet and then analyzed by Statistica version 6 (Tulsa, Oklahoma: StatSoft Inc., 2001) software. Descriptive statistics was generated including mean, standard deviation, and 10th, 25th, 50th, 75th, 90th percentile values. The linear association between GA and anthropometric dimensions was explored using scatter plots and quantified by Pearson’s correlation coefficient (r). Correlation of HC and CHL with GA was strong enough to go for simple and multiple linear regression analysis, and predictive equations generated. The predictive equation from multiple regressions, incorporating both HC and CHL, was applied to a test cohort of 30 children and the margin of error determined from the difference between actual and predicted GA.
Results
Out of 530 neonates, 445 (272 males and 173 females) were recruited for the study as the rest did not meet the inclusion criteria. Figure 1 provides a flowchart of analysis numbers. The demographic summary of the study population is given in Table 1. Further, the sample was divided into term 166 (37 to 41 weeks) and preterm 279 (28 to < 37 weeks). Of the anthropometric parameters measured, namely HC, CHL, and anterior fontanel area, only the former two showed a strong correlation with GA [Tables 2 and 3, and Figures 2 and 3].
HC increased with with increasing GA (i.e., from 24.7±1.4 cm at 28 weeks to 33.8±1.2 cm at 41 weeks). The r-value for correlation of HC with GA was 0.863 and regression equation for calculation of GA from HC was GA (weeks) = 9.2671 + [0.8616 × HC (cm)].
CHL increased steadily with increasing GA from 34.7±1.3 cm at 28 weeks to 49.9±2.5 cm at 41 weeks. The r-value was 0.859 and the regression equation to calculate GA from length was GA (weeks) = 7.2489 + [0.621 × CHL (cm)].
We also derived a multiple linear regression equation to predict gestational age from CHL and HC in a whole cohort. This predictive equation was: GA (weeks) = 4.0244 + [0.4058 × HC (cm)] + [0.4249 × CHL (cm)].
We used this predictive equation to predict the GA from HC and CHL measurements in a separate test cohort of 30 babies. In this cohort, the predicted GA was 33.8±3.5 weeks against the actual GA of 33.4±3.8 weeks. The margin of error was 2.9±1.9%, indicating that the predictive equation was acceptable.
Table 1: Table showing mean standard deviation (SD) and percentiles (PC) for birth weight, head circumference (HC), crown-heel length (CHL), anterior fontanel area (AFA), New Ballard Score (NBS), and gestational age (GA) (n = 445).
|
Age, days |
3.3 ± 0.7 |
3.0 |
3.0 |
3.0 |
|
Birth weight, kg |
1.9 ± 0.6 |
1.4 |
1.8 |
2.4 |
|
HC, cm |
29.1 ± 3.4 |
26.5 |
29.0 |
32.0 |
|
CHL, cm |
43.5 ± 5.1 |
40.0 |
44.0 |
48.0 |
|
AFA, cm2 |
3.2 ± 1.7 |
2.0 |
2.8 |
4.0 |
|
NBS |
26.4 ± 9.5 |
18.5 |
28.0 |
35.0 |
Table 2: Variation of head circumference (HC) with gestational age (GA) (n = 445).
|
28 |
27 |
24.7 ± 1.4 |
23.6 |
23.8 |
24.1 |
24.8 |
27.0 |
|
29 |
31 |
25.1 ± 1.3 |
24.1 |
24.3 |
24.6 |
24.9 |
28.0 |
|
30 |
27 |
25.4 ± 1.7 |
24.1 |
24.3 |
24.8 |
25.4 |
29.0 |
|
31 |
30 |
27.3 ± 1.8 |
25.7 |
26.0 |
26.5 |
29.0 |
30.0 |
|
32 |
28 |
26.4 ± 4.8 |
26.0 |
26.5 |
27.0 |
27.5 |
29.0 |
|
33 |
35 |
27.4 ± 1.4 |
26.1 |
26.5 |
27.0 |
28.0 |
30.0 |
|
34 |
31 |
28.8 ± 1.9 |
26.3 |
28.0 |
28.8 |
29.6 |
31.5 |
|
35 |
29 |
28.8 ± 1.6 |
27.0 |
27.6 |
29.0 |
29.5 |
32.0 |
|
36 |
41 |
30.9 ± 1.5 |
29.0 |
30.0 |
31.0 |
32.0 |
33.0 |
|
37 |
36 |
30.4 ± 1.8 |
28.0 |
29.0 |
30.2 |
32.0 |
33.0 |
|
38 |
41 |
32.1 ± 1.3 |
30.0 |
31.0 |
32.5 |
33.0 |
34.0 |
|
39 |
28 |
33.1 ± 1.3 |
31.0 |
32.0 |
33.0 |
34.5 |
35.0 |
|
40 |
33 |
33.6 ± 1.1 |
32.0 |
33.0 |
34.0 |
34.5 |
35.0 |
SD: standard deviation; PC: percentile.
Table 3: Gestational age (GA) variation of crown-heel length (CHL) (n = 445).
|
28 |
27 |
34.7 ± 1.3 |
33.0 |
34.0 |
35.0 |
36.0 |
36.3 |
|
29 |
31 |
36.6 ± 1.0 |
35.3 |
36.0 |
36.7 |
37.2 |
38.0 |
|
30 |
27 |
37.1 ± 2.0 |
35.0 |
36.0 |
36.5 |
39.0 |
40.0 |
|
31 |
30 |
40.2 ± 2.4 |
36.5 |
39.0 |
41.0 |
42.0 |
43.0 |
|
32 |
28 |
41.4 ± 2.2 |
37.0 |
40.5 |
42.0 |
43.0 |
44.0 |
|
33 |
35 |
41.9 ± 2.7 |
38.0 |
40.0 |
42.0 |
44.0 |
45.0 |
|
34 |
31 |
43.6 ± 2.2 |
40.0 |
43.0 |
44.0 |
45.0 |
46.0 |
|
35 |
29 |
44.9 ± 2.3 |
42.0 |
44.0 |
45.0 |
46.0 |
48.0 |
|
36 |
41 |
45.3 ± 3.5 |
43.0 |
44.0 |
45.0 |
47.0 |
49.0 |
|
37 |
36 |
47.5 ± 2.0 |
45.0 |
46.0 |
48.0 |
49.0 |
50.0 |
|
38 |
41 |
48.2 ± 2.5 |
45.0 |
47.0 |
49.0 |
50.0 |
51.0 |
|
39 |
28 |
49.9 ± 2.4 |
46.0 |
49.0 |
50.0 |
52.0 |
53.0 |
|
40 |
33 |
48.8 ± 2.5 |
45.0 |
48.5 |
49.0 |
50.0 |
51.0 |
SD: standard deviation; PC: percentile.
Discussion
Prematurity is a major determinant of neonatal survival. Estimation of GA by methods like recall of LMP is prone to error, and ultrasonic assessment is often difficult to use in resource-poor countries. In developing countries, less than half of neonates undergo any evaluation within 24 hours of birth.12
The NBS score used for GA assessment has both physical and neuronal criteria. It has fallacies as it requires a person trained in pediatrics and furthermore it is a subjective test. Neurological examination requires both skill and training. In contrast, anthropometric measurements collected by health workers have been shown to be more reliable than clinical examination.13,14
A study conducted on a Western Indian population found a strong correlation between GA and HC (r = 0.977).15 Another study observed a strong linear correlation between HC (r = 0.95) and the estimated GA between 25 and 42 weeks.16 In our case, in the age range of Eastern Indian babies between 28 and 41 weeks, the correlation was 0.863.
Another study of neonates delivered in a Western Indian population observed that GA varied from 25 to 42 weeks, with 373 neonates (37.3%) being preterm and 62.7% being term.17 They found a good linear correlation between GA and CHL with r = 0.56. They proposed a linear regression equation: GA (weeks) = 20.06 + [0.34 × CHL (cm)]. We found even stronger correlation (r = 0.859) between CHL and GA and our regression equation is: GA (weeks) = 7.2489 + [0.621 × CHL (cm)].
The strength of our study is that the entire examination was conducted by a medical person trained in examining the newborns and not by any peripheral health worker or traditional birth attendant. Each week of gestational age between 28 and 41 weeks was adequately represented.
This study also has its share of limitations. This sample may not be a true representation of community settings as we conducted the study in a tertiary care center. We had to exclude newborns at 42 weeks gestation due to inadequate numbers. Finally, we did not do a longitudinal follow-up of the babies to determine whether the associations hold at a later age.
Conclusion
HC and CHL measurement are quick and reliable parameters that can be used as an anthropometric surrogate for estimation of GA. These can be used by peripheral health care workers and traditional birth attendants and could be effectively used for identifying and referring high-risk newborns.
Disclosure
The authors declared no conflicts of interest. No funding was received for this study.
references
- 1. World Health Organization. Child health profile: India. Geneva: Department of Child and Adolescent Health and Development, World Health Organization;2007.
- 2. March of Dimes. Born Too Soon. Global Action Report on Preterm Birth. 2012. Howson CP, Kinney MV, Lawn JE, editors. Geneva: World Health Organization, 2012 [cited 2018 April 22]. Available from: http://www.who.int/pmnch/media/news/2012/201204_borntoosoon-report.pdf.
- 3. Blanc AK, Wardlaw T. Monitoring low birth weight: an evaluation of international estimates and an updated estimation procedure. Bull World Health Organ 2005 Mar;83(3):178-185.
- 4. Savitz DA, Terry JW Jr, Dole N, Thorp JM Jr, Siega-Riz AM, Herring AH. Comparison of pregnancy dating by last menstrual period, ultrasound scanning, and their combination. Am J Obstet Gynecol 2002 Dec;187(6):1660-1666.
- 5. Ministry of Health and Family Welfare, Government of India. National Family Health Survey (NFHS- 3), 2005-06: India. Key findings. Mumbai: International Institute for Population Sciences;2007. p. 24.
- 6. Moraes CL, Reichenheim ME. [Validity of neonatal clinical assessment for estimation of gestational age: comparison of new ++Ballard+ score with date of last menstrual period and ultrasonography]. Cad Saude Publica 2000 Jan-Mar;16(1):83-94.
- 7. Mullany LC, Darmstadt GL, Coffey P, Khatry SK, LeClerq SC, Tielsch JM. A low cost, colour coded, hand held spring scale accurately categorises birth weight in low resource settings. Arch Dis Child 2006 May;91(5):410-413.
- 8. Sreeramareddy CT, Chuni N, Patil R, Singh D, Shakya B. Anthropometric surrogates to identify low birth weight Nepalese newborns: a hospital-based study. BMC Pediatr 2008 Apr;8:16.
- 9. Samimi M, Asemi Z, Taghizadeh M, Azarbad Z. Rahimi–Foroushani A, Sarahroodi S. Concentration of Serum Zinc, Hemoglobin and Ferritin among Pregnant Women and their Effects on Birth Outcomes in Kashan, Iran. Oman Med J 2012;27(1):40-45.
- 10. Bashir R. Estimated date of birth. In:Bashir R, editor. Manual on pregnancy, labour and puerperium. Chapter 5. New Delhi: Daya Publication House; 2008. p. 28.
- 11. Carlo WA. The high- risk infant. In: Kliegman RM, Stanton BF, Geme JW, Schor NF, Behrman RE, editors. Nelson textbook of paediatrics. 19th ed. Philadelphia, PA: Saunders, 2011. p.552.
- 12. United Nations Children’s Fund. National factsheet; Coverage Evaluation Survey. UNICEF;2009. New Delhi: United Nations Children’s Fund [cited 2018 April 22]. Available from: http://www.indiaenvironmentportal.org.in/files/National_Factsheet_30_August_no_logo.pdf.
- 13. Ngirabega JD, Hakizimana C, Wendy L, Munyanshongore C, Donnen P. Dramaix-Wilmet M. [Reliability of anthropometric measurements performed by community nutrition workers in a community-based pediatric growth-monitoring program in rural Rwanda]. Rev Epidemiol Sante Publique 2010;58(6):409-414.
- 14. Johnson W, Cameron N, Dickson P, Emsley S, Raynor P, Seymour C, et al. The reliability of routine anthropometric data collected by health workers: a cross-sectional study. Int J Nurs Stud 2009 Mar;46(3):310-316.
- 15. Gandhi D, Masand R, Purohit A. A simple method for assessment of gestational age in neonates using head circumference. Global Journal for Research Analysis 2014;3(5):211-213 .
- 16. Sasanow SR, Georgieff MK, Pereira GR. Mid-arm circumference and mid-arm/head circumference ratios: standard curves for anthropometric assessment of neonatal nutritional status. J Pediatr 1986 Aug;109(2):311-315.
- 17. Thawani R, Dewan P, Faridi MM, Arora SK, Kumar R. Estimation of gestational age, using neonatal anthropometry: a cross-sectional study in India. J Health Popul Nutr 2013 Dec;31(4):523-530.