Surgical risk prediction models have proven to be invaluable tools for surgeons. Appropriate risk-stratification can enable patients to be better informed, improve patient selection, and facilitate a generation of better treatment plans; therefore, improving overall outcomes.1–3 To quantify the risk of perioperative morbidity and mortality, different scoring systems have been developed, including the physiological and operative severity score for the enumeration of mortality and morbidity (POSSUM) and Portsmouth POSSUM (P-POSSUM).4
Early prognostic evaluation helps identify high-risk patients who may require more aggressive interventions, thereby optimizing the allocation of healthcare resources.5 Although the surgeon’s skill remains the most crucial factor, other variables include the patient’s health history, the disease that requires surgical intervention, and the overall perioperative management. The POSSUM scoring system was designed to combine these variables and predict the patient’s outcome.
The risk of a surgical procedure could be calculated based on a patient’s physiological condition and operative findings, which are then pooled.6 POSSUM processes the clinical data using a logarithmic model, derives a physiological score and an operative severity score, and then combines both to predict an overall risk of morbidity and mortality. The POSSUM score includes 12 physiological parameters and six operative parameters. The morbidity and mortality risk of all patients in a cohort can be calculated using the linear method of analysis as described by Copeland.6 Subsequently, a modification to the predictor equation was proposed as the P-POSSUM, which claimed to produce a closer fit with the observed in-hospital mortality in low-risk groups. In India, P-POSSUM scores have been verified among different population groups and surgical practices.7–9
Most studies have been conducted in developed countries, where patient characteristics, presentation, and hospital resources differ from those in India, especially in public sector healthcare centers such as ours. The majority of our patients belong to lower socioeconomic statuses, where problems like delayed presentation and limited resources can affect the outcome even with adequate quality care. By using scoring methods tested for our patients, we should be able to predict better the risk of morbidity and mortality in patients requiring surgical intervention and plan their management optimally. Therefore, we sought to validate POSSUM and P-POSSUM in an Indian healthcare setting.
Methods
This prospective observational study was carried out in the Department of General Surgery, ESIC Model Hospital and Postgraduate Institute of Medical Sciences and Research (ESI-PGIMSR), New Delhi, after obtaining clearance from the Institutional Ethics Committee at ESI-PGIMSR, Basaidarapur (Ref. DM(A)H-19/14/17/IEC/2012-PGIMSR). Written informed consent was taken from the enrolled patients.
The sample size for the study was calculated using the following formula:
|
N = Z2 1-α/2*
|
[Sn(1-Sn)]
|
|
[L 2(1-P)]
|
N = required sample size; Zá = 1.96 at a 95% CI; Sn = sensitivity; L = margin of error; and P = mortality rate in emergency laparotomy patients.
The sensitivity of the P-POSSUM score in predicting mortality in an Indian hospital setting was previously calculated as 91.3% by Nag et al.5 Assuming the same sensitivity with a 10% margin of error, we estimated the required sample size to be 41. To account for potential attrition, the sample size was increased to 45.
The potential participants were all patients > 18 years of age undergoing emergency gastrointestinal surgeries at our institution from 28 November 2020 to 20 May 2022. Individuals with multiorgan failure, polytrauma, and those who were unwilling to participate were excluded. Diagnosis and decision for emergency gastrointestinal surgery were taken based on each patient’s clinical examination and other investigations.
Each patient’s physiological and operative scores were calculated as per the parameters and scoring system [Tables 1 and 2]. These scores were used to calculate the POSSUM score.
Table 1: Variables for the POSSUM physiological score in emergency gastrointestinal surgical patients.
|
Cardiac signs/medications taken
|
Normal
|
Diuretic, digoxin, antianginal, or antihypertensive medication
|
Peripheral edema, warfarin therapy
|
Raised JVP
|
|
Chest radiograph
|
Normal
|
–
|
Borderline cardiomegaly
|
Cardiomegaly
|
|
Respiratory history
|
Normal
|
Dyspnea on exertion
|
Limiting dyspnea (one flight of stairs)
|
Dyspnea at rest
|
|
Chest radiograph
|
Normal
|
Mild COPD
|
Moderate COPD
|
Fibrosis or consolidation
|
|
Systolic BP, mm Hg
|
110–130
|
131–170 or 100–109
|
≥ 171 or 90–99
|
≤ 89
|
|
Pulse, beats/min
|
50–80
|
81–100 or 40–49
|
100–120
|
≥ 121 or ≤ 89
|
|
Glasgow coma scale
|
15
|
12–14
|
9–11
|
< 9
|
|
Hemoglobin, g/dL
|
13.0–16.0
|
11.5–12.9 or 16.1–17.0
|
10.0–11.4 or 17.1–18.0
|
< 10.0
|
|
White cell count, 1012/L
|
4.0–10.0
|
10.1–20.0 or 3.1–4.0
|
> 20.0 or < 4.0
|
|
|
Blood urea, mmol/L
|
< 7.5
|
7.6–10.0
|
10.1–15.0
|
> 15.0
|
|
Sodium, mmol/L
|
> 135
|
131–135
|
126–130
|
< 126
|
|
Potassium, mmol/L
|
3.5–5.5
|
3.2–3.4 or 5.2–5.3
|
2.9–3.1 or 5.4–5.9
|
< 2.9 or > 5.9
|
POSSUM: Physiological and Operative Severity Score for the enUmeration of Mortality and Morbidity; JVP: jugular venous pressure; COPD: chronic obstructive pulmonary disease; BP: blood pressure; ECG: electrocardiogram.
Table 2: Variables for the POSSUM operative score in emergency gastrointestinal surgical patients.
|
Operative severity
|
Minor
|
Intermediate
|
Major
|
Major
|
|
No. of surgeries within 30 days
|
1
|
|
2
|
> 2
|
|
Blood loss per surgery, mL
|
< 101
|
101–500
|
501–999
|
> 999
|
|
Peritoneal contamination
|
None
|
Serous fluid
|
Local pus
|
Free bowel content/pus/blood
|
|
Presence of malignancy
|
None
|
Primary only
|
Nodal metastasis
|
Distant metastasis
|
POSSUM: Physiological and Operative Severity Score for the enUmeration of Mortality and Morbidity.
POSSUM equation for morbidity
The predicted risk of morbidity (R1) was
calculated using the POSSUM equation for mortality as follows:
ln [R/(1 − R)] = -7.04 + (0.13 × physiological score) + (0.16 × operative severity score)
The predicted risk of mortality (R) was calculated using the following equation:
ln [R/(1 − R)] = -9.37 + (0.19 × physiological score) + (0.15 × operative severity score)
After surgery, each patient was monitored for 30 days for postoperative morbidity/mortality.
Morbidity was assessed using the Clavien-Dindo classification.10 Morbidity outcome measures were evaluated by assessing the development of postoperative morbidities such as wound complications, local or systemic infections, organ dysfunction, shock, thromboembolism, and anastomotic failure.
Statistical analysis was performed using IBM SPSS Statistics (IBM Corp. Released 2011. IBM SPSS Statistics for Windows, Version 20.0. Armonk, NY: IBM Corp.). Quantitative data were expressed as mean ± SD or median with IQR, depending on the distribution’s normality. Differences between the two means were verified using the Student’s t-test or the Mann-Whitney U test. Qualitative data were expressed as percentages. Differences between proportions were assessed by chi-square test or Fisher’s exact test. Pearson’s correlation coefficient was used to assess the correlation between two quantitative variables. Receiver operating characteristic (ROC) curves were generated using the P-POSSUM and POSSUM scores to predict mortality. Based on the ROC curves, the optimum cutoff values were calculated. Sensitivity, specificity, and positive and negative predictive values of P-POSSUM and POSSUM scores were calculated. A p-value < 0.05 was considered statistically significant.
Results
The mean age of the 45 patients selected for the study was 37.9 ± 15.7 years, with an age range of 18–72 years, a median of 32.0 years, and an IQR of 26.0–47.0 years. The male-to-female ratio was 1.5:1.0. The age distribution of the participants was as follows: 62.2% were aged 18–40 years, 28.9% were aged 41–60 years, and 8.9% were > 60 years.
Tables 3 and 4 summarize the clinical and laboratory findings, clinical history, and imaging results of the patients.
Table 3: Clinical and laboratory findings of patients (N = 45).
|
Systolic BP, mmHg
|
117.5 ± 16.3
|
116.0 (106.0–130.0)
|
86.0–150.0
|
|
Pulse, rate/min
|
105.8 ± 18.8
|
105.0 (90.0–120.0)
|
78.0–140.0
|
|
Glasgow coma scale
|
15.0 ± 0.2
|
15.0 (15.0–15.0)
|
14.0–15.0
|
|
Hemoglobin, gm/dL
|
11.1 ± 2.1
|
11.2 (9.7–12.3)
|
7.6–16.2
|
|
TLC/mm3
|
12102.0 ± 7000.0
|
9800 (7700–16000)
|
1900–36000
|
|
Blood urea, mmol/L
|
3.4 ± 1.5
|
3.5 (2.5–4.3)
|
0.6–7.8
|
|
S. Sodium, mEq/L
|
132.8 ± 5.3
|
134.0 (128.0–136.0)
|
122.0–144.0
|
BP: blood pressure; TLC: total leukocyte count; S: serum.
Table 4: Patients’ clinical history, imaging data, and diagnoses (N = 45).
|
Clinical history
|
|
|
Cardiac disease history
|
0 (0.0)
|
|
Respiratory disease history
|
|
|
None
|
38 (84.4)
|
|
Dyspnea
|
5 (11.1)
|
|
Dyspnea at rest
|
3 (6.7)
|
|
Imaging (chest X-ray) data
|
|
|
Normal
|
37 (82.2)
|
|
Pleural effusion
|
5 (11.1)
|
|
Cardiomegaly
|
1 (2.2)
|
|
Cavitary lesion
|
1 (2.2)
|
|
Fibrosis
|
1 (2.2)
|
|
Diagnoses indicative of emergency surgery
|
|
|
Intestinal perforation
|
15 (33.3)
|
|
Acute appendicitis
|
8 (17.8)
|
|
Subacute intestinal obstruction
|
7 (15.6)
|
|
Liver abscess
|
3 (6.7)
|
|
Pyoperitoneum
|
3 (6.7)
|
|
Gastrointestinal malignancy
|
2 (4.4)
|
|
Acute necrotizing pancreatitis
|
2 (4.4)
|
|
Abdominal Koch’s
|
1 (2.2)
|
|
Blunt trauma abdomen
|
1 (2.2)
|
|
Sigmoid volvulus
|
1 (2.2)
|
|
Strangulated inguinal hernia
|
1 (2.2)
|
All participants were free of cardiac pathology. Eight (17.8%) patients had a history of respiratory disease, including three who had dyspnea at rest. Five patients were noted to have pleural effusion on chest X-ray. The major diagnoses that necessitated emergency surgery was intestinal perforations found in 15 (33.3%) patients, followed by acute appendicitis in eight (17.8%) patients [Table 4].
Table 5 shows the operative data and perioperative complications. All participants underwent emergency gastrointestinal surgery. Most (33; 73.3%) surgeries were classified as major, and the remaining 12 (26.7%) were of intermediate complexity.
Table 5: Operative data and perioperative complications (N = 45).
|
Emergency surgery
|
45 (100)
|
|
Operative complexity (severity)
|
|
Minor
|
0 (0.0)
|
|
Intermediate
|
12 (26.7)
|
|
Major
|
33 (73.3)
|
|
Number of operations within 30 days
|
|
|
1
|
44 (97.8)
|
|
2
|
1 (2.2)
|
|
Perioperative complications
|
Mean ± SD; Median (IQR); (min–max)
|
Verification
|
|
Major
|
20.7 ± 3.9; 20.0 (20.0–22.5); (13.0–27.0)
|
W = 389
p ≤ 0.001
|
|
Minor
|
15.3 ± 4.6;13.0 (10.0–20.0); (10.0–20.0)
|
|
|
Blood loss associated with surgery
|
|
Major
|
251.5 ± 143.3; 225.0 (150.0–350.0); (50.0–650.0)
|
KW: X2 = 16.041
p ≤ 0.001
|
|
Intermediate
|
75.0 ± 50.0; 50.0 (50.0–62.5); (50.0–200.0)
|
|
|
Peritoneal contamination
|
17 (37.8)
|
|
Bowel content
|
14 (31.1)
|
|
Local pus
|
2 (4.4)
|
|
Blood
|
1 (2.2)
|
|
Pus
|
11 (24.4)
|
|
Presence of malignancy
|
|
|
None
|
40 (88.9)
|
|
Primary malignancy
|
4 (8.9)
|
|
Malignancy with distant metastasis
|
1 (2.2)
|
|
Major complications
|
|
|
Overall
|
18 (40.0)
|
|
Age: 18–40 years (n = 28)
|
8 (28.6)
|
|
Age: 41–60 years (n = 13)
|
6 (46.2)
|
|
Age: > 60 years (n = 4)
|
4 (100)
|
|
Fecal peritoneal contamination
|
8 (44.4)
|
|
Overall mortality
|
8 (17.8)
|
|
18–40 years (n = 28)
|
2 (7.1)
|
|
41–60 years (n = 13 )
|
4 (30.8)
|
W: Wilcoxon-Mann-Whitney test; KW: Kruskal-Wallis test.
Blood loss tended to be significantly greater in patients who underwent major surgeries (Wilcoxon-Mann-Whitney (W) = 337.0; p = 0.028). The overall mean blood loss associated with major surgeries was 251.5 ± 143.3 mL; 225.0 mL (IQR = 150.0–350.0). For intermediate surgeries, the mean blood loss was 75.0 ± 50.0 mL; IQR = 50.0–62.5 mL. In addition, 37.8% of participants had peritoneal contamination, 31.1% had peritoneal fecal contamination, and 24.4% had peritoneal contamination with pus. Primary malignancy was present in 8.9% of patients, while 2.2% had malignancy with distant metastasis [Table 5].
Major complications were reported in 18 (40.0%) participants. There was a significant difference in the development of major complications among patients with different types of peritoneal contamination (χ2 = 9.814; p = 0.024). Patients with peritoneal fecal contamination were more likely to develop major complications than those without it [Table 5]. Eight (17.8%) participants died during the 30-day monitoring period, with a significantly high prevalence among those > 60 years old (p = 0.027) [Table 5].
Table 6 presents the final predictive scores of morbidity and mortality based on the POSSUM and P-POSSUM models.
Table 6: POSSUM and P-POSSUM predictive scores of morbidity and mortality, and Clavien-Dindo classifications of emergency surgical patients (N = 45).
|
POSSUM (physiological)
|
24.0 ± 8.3
|
23.0 (16.0–29.0)
|
13.0–49.0
|
|
|
POSSUM (operative)
|
17.4 ± 5.0
|
20.0 (13.0–20.0)
|
10.0–27.0
|
|
|
POSSUM mortality
|
30.6 ± 24.3
|
27.3 (6.2–45.0)
|
2.3–89.8
|
|
|
POSSUM morbidity
|
66.6 ± 31.1
|
80.4 (34.3–91.5)
|
12.7–99.5
|
|
|
P-POSSUM morbidity
|
67.3 ± 31.7
|
82.8 (30.8–93.6)
|
12.7–99.7
|
|
|
P-POSSUM mortality
|
18.7 ± 21.6
|
12.2 (1.5–27.1)
|
0.5–92.3
|
|
|
Clavien-Dindo grade 1
|
|
|
|
14 (31.1)
|
|
Clavien-Dindo grade 2
|
|
|
|
11 (24.4)
|
|
Clavien-Dindo grade 3
|
|
|
|
10 (22.2)
|
|
Clavien-Dindo grade 4
|
|
|
|
2 (4.4)
|
POSSUM: Physiological and Operative Severity Score for the enUmeration of Mortality and Morbidity; P-POSSUM: Portsmouth POSSUM.
The POSSUM physiological score comprised a mean of 24.0 ± 8.3, a median of 23.0 (IQR = 16.0–29.0), and a range of 13.0–49.0. The operative score had a mean of 17.4 ± 5.0, a median of 20.0 (IQR = 13.0–20.0), and a range of 10.0–27.0 [Table 6].
Based on the 30-day postoperative monitoring, the Clavien-Dindo grades of the participants were as follows: grade 1, 14 (31.1%) participants; grade 2, 11 (24.4%); grade 3, 10 (22.2%); grade 4, two (4.4%); and grade 5, eight (17.8%) [Table 6].
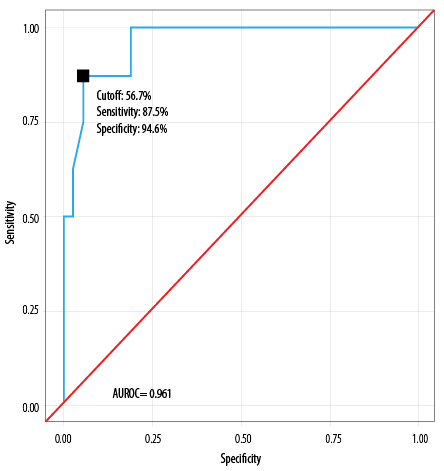
We generated POSSUM and P-POSSUM risk predictions for mortality and morbidity in the study participants. These were then analyzed using the area under the ROC curve (AUROC) [Tables 7–10].
The AUROC for the POSSUM mortality risk model was 0.961 (95% CI: 0.906–1.000), demonstrating excellent performance (p < 0.001). Using a POSSUM mortality risk score of ≥ 56.7%, the model achieved a sensitivity of 87.6% and a specificity of 94.6% [Table 7]. A risk score of ≥ 56.7% was associated with an odds ratio (OR) of 52.5 (95% CI: 6.2–447.5) and a relative risk of 13.9 (95% CI: 3.8–52.2).
Table 7: Diagnostic performance of POSSUM mortality prediction model, analyzed by AUROC (N = 45).

|
Cutoff (p value)
|
≥ 56.7 (p < 0.001)
|
|
AUROC
|
0.961 (0.906–1.000)
|
|
Sensitivity
|
87.5 (47.0–100)
|
|
Specificity
|
94.6 (82.0–99.0)
|
|
Positive predictive value
|
77.8 (40.0–97.0)
|
|
Negative predictive value
|
97.2 (85.0–100)
|
|
Diagnostic accuracy
|
93.3 (82.0–99.0)
|
|
Positive likelihood ratio
|
16.2 (4.1–63.9)
|
|
Negative likelihood ratio
|
0.1 (0.0–0.8)
|
POSSUM: Physiological and Operative Severity Score for the enUmeration of Mortality and Morbidity; AUROC: area under the receiver operating characteristic curve.
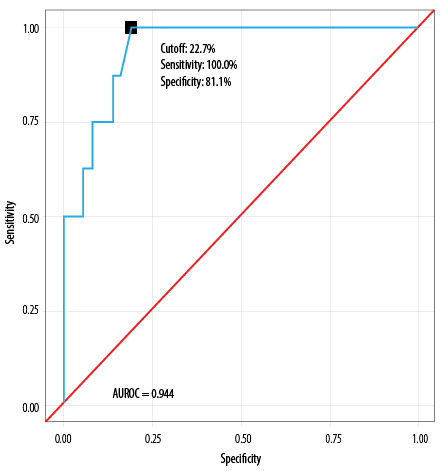
Table 8 shows that the P-POSSUM mortality risk model demonstrated diagnostic excellence, achieving an AUROC of 0.944 (95% CI: 0.879–1.000); p < 0.001. At a P-POSSUM mortality risk score ≥ 22.7%, it predicted mortality with a sensitivity of 100% and a specificity of 81.1%. A risk score of ≥ 22.7 was associated with an OR of 36.2 (95% CI: 3.7–350.2) and a relative risk of 17.2 (3.1–101.5).
Table 8: Diagnostic performance of P-POSSUM mortality prediction model, as analyzed by AUROC (N = 45).

|
Cutoff (p-value)
|
≥ 22.7 (p < 0.001)
|
|
AUROC
|
0.944 (0.879 –1.000)
|
|
Sensitivity
|
100 (63.0–100)
|
|
Specificity
|
81.1 (65.0–92.0)
|
|
Positive predictive value
|
53.3 (27.0–79.0)
|
|
Negative predictive value
|
100 (88.0–100)
|
|
Diagnostic accuracy
|
84.4 (71–94)
|
|
Positive likelihood ratio
|
5.29 (2.71–10.3)
|
|
Negative likelihood ratio
|
0 (0–NaN)
|
P-POSSUM: Portsmouth Physiological and Operative Severity Score for the enUmeration of Mortality and Morbidity; AUROC: area under the receiver operating characteristic curve; NaN: not a number; Inf: infinity.
The AUROC analysis revealed excellent morbidity prediction capability of both POSSUM and P-POSSUM models [Tables 9–10].
Table 9: Diagnostic performance of POSSUM morbidity prediction model, as revealed by AUROC (N = 45).

|
Cutoff (p-value)
|
≥ 87.5 (< 0.001)
|
|
AUROC
|
0.945 (0.886–1.000)
|
|
Sensitivity
|
83.3 (59.0–96.0)
|
|
Specificity
|
92.6 (76.0–99.0)
|
|
Positive predictive value
|
88.2 (64.0–99.0)
|
|
Negative predictive value
|
89.3 (72.0–98.0)
|
|
Diagnostic accuracy
|
88.9 (76.0–96.0)
|
|
Positive likelihood ratio
|
11.3 (2.9–43.4)
|
|
Negative likelihood ratio
|
0.2 (0.1–0.5)
|
POSSUM: Physiological and Operative Severity Score for the enUmeration of Mortality and Morbidity; AUROC: area under the receiver operating characteristic curve.
Table 10: Diagnostic performance of P-POSSUM morbidity prediction model as revealed by
AUROC (N = 45).

|
Cutoff (p-value)
|
≥ 88.6 (< 0.001)
|
|
AUROC
|
0.958 (0.903–1.000)
|
|
Sensitivity
|
88.9 (65.0–99.0)
|
|
Specificity
|
96.3 (81.0–100)
|
|
Positive predictive value
|
94.1 (71.0–100)
|
|
Negative predictive value
|
92.9 (76.0–99.0)
|
|
Diagnostic accuracy
|
93.3 (82.0–99.0)
|
|
Positive likelihood ratio
|
24.0 (3.5–165.4)
|
|
Negative likelihood ratio
|
0.1 (0.0–0.4)
|
P-POSSUM: Portsmouth Physiological and Operative Severity Score for the enUmeration of Mortality and Morbidity; AUROC: area under the receiver operating characteristic curve.
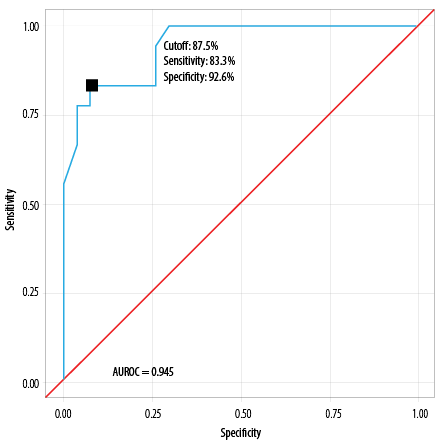
The AUROC for POSSUM morbidity risk predicting major complications was 0.945 (95% CI: 0.886–1.000), thus demonstrating excellent diagnostic performance (p < 0.001) [Table 6].
At a cutoff of POSSUM morbidity risk ≥ 87.5, it predicts major complications, with a sensitivity of 83.3% and a specificity of 92.6%.
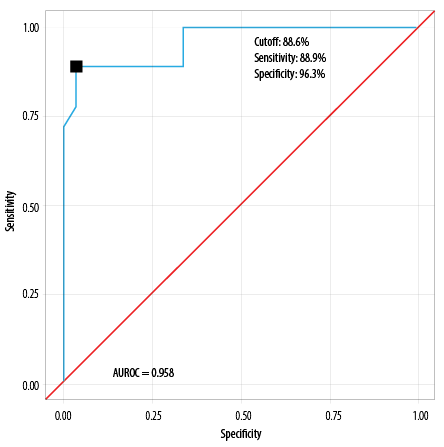
AUROC for P-POSSUM morbidity risk predicting major complications was 0.958 (95% CI: 0.903–1.000), thus demonstrating excellent diagnostic performance (p < 0.001) [Table 7].
At a cutoff of P-POSSUM morbidity risk ≥ 88.6, it predicts major complications, with a sensitivity of 88.9% and a specificity of 96.3%.
The POSSUM morbidity model predicted significant differences between the five Clavien-Dindo groups (χ2 = 35.539; p < 0.001), with the median POSSUM morbidity being highest for grade 5 patients [Table 11].
Table 11: Comparison of the five Clavien-Dindo grades in terms of POSSUM morbidity model (N = 45).
|
Mean
|
26.2 ± 14.8
|
74.4 ± 18.5
|
86.1 ± 7.7
|
92.1 ± 0.8)
|
96.0 ± 3.4
|
|
Median (IQR)
|
19.3
(15.1–31.4)
|
82.8
(66.0–86.9)
|
87.2
(79.8–91.1)
|
92.1
(91.8–92.3)
|
96.8
(95.2–98.2)
|
POSSUM: Physiological and Operative Severity Score for the enUmeration of Mortality and Morbidity.
Similarly, there were significant differences between the five Clavien-Dindo groups in terms of the P-POSSUM morbidity model as well (χ2 = 36.602; p < 0.001), with the median P-POSSUM morbidity being highest for patients in the Clavien-Dindo grade 5 [Table 12].
Table 12: Comparison of the five subgroups of the Clavien-Dindo grades in terms of P-POSSUM
morbidity (n = 45).
|
Mean (SD)
|
24.5 (11.3)
|
76.9 (16.8)
|
87.3 (8.0)
|
96.1 (0.3)
|
96.4 (3.0)
|
|
Median (IQR)
|
22.8
(17.2–28.5)
|
82.8
(77.6–86.3)
|
89.2
(80.0–93.7)
|
96.1
(96.0–96.2)
|
96.9
(94.4–99.0)
|
P-POSSUM: Portsmouth Physiological and Operative Severity Score for the enUmeration of Mortality and Morbidity.
Discussion
This study evaluated 45 patients undergoing emergency gastrointestinal surgery in India and predicted their perioperative morbidity and mortality by calculating their POSSUM and P-POSSUM scores, based on their preoperative (physiological) and intraoperative (surgical) data. First, the physiological component of the POSSUM score was calculated preoperatively. Thereafter, the patients’ postoperative morbidity was observed for 30 days and graded using the Clavien-Dindo scale.
The mean age of the patients was 37.9 years, which was comparable to the mean age of 37.1 years in a previous Indian study.11 Eight (17.8%) patients passed away during the 30-day follow-up period. The oldest ( > 60 years) participants had a death rate of 50.0%, attributable to age-related comorbidities and a higher risk of complications.
Both the physiological and operative POSSUM scores were significant predictors of mortality and morbidity. The physiological score was significantly higher among patients who had mortality, demonstrating excellent diagnostic performance as confirmed by AUROC analysis. Cutoff scores of ≥ 26 and ≥ 28 significantly predicted patients with elevated risks of morbidity and mortality, respectively. Similar findings were reported in a Zimbabwean study among 180 surgical patients, where POSSUM physiological scores correlated significantly with patient morbidity and mortality.12 This was further supported by additional studies, which suggested that POSSUM physiological score can be used in isolation for the risk stratification of patients preoperatively.13,14
Similarly, the POSSUM operative scores in the current study significantly identified patients with high morbidity and mortality risks. An operative cutoff score of ≥ 19 significantly predicted high morbidity risk, while an operative cutoff score of ≥ 21 significantly predicted mortality risk, as confirmed by ROC analysis. A 2016 study among 721 patients in Spain also demonstrated the high predictive value of POSSUM operative scores.15 Further, a recent study in the Eastern Indian state of Orissa found a mean physiological score of 24.6 and a mean operative score of 19.0, similar to our findings.4 In the Zimbabwean study,12 the operative scores correlated significantly with patient morbidity and mortality. These findings are supported by other studies, suggesting that operative score can also be used in isolation for preoperative risk stratification of patients.14
In this study, peritoneal contamination was associated with significant postoperative complications. Additionally, patients who experienced major complications had significantly higher physiological scores than those without. These findings align with those of previous studies. For example, a study by Chatterjee et al,16 involving 50 patients in India found that POSSUM scores of patients with perforation peritonitis significantly predicted postsurgical mortality. We also found that high operative and morbidity POSSUM scores significantly predicted major complications. Similarly, the Zimbabwean study showed a significant correlation between POSSUM morbidity scores and postoperative morbidity and mortality.12
The AUROCs of the POSSUM morbidity and mortality scores (0.945 and 0.961, respectively) in the current study confirmed their high prognostic performance, enabling effective identification of high-risk patients with high sensitivity and specificity. Chatterjee et al,16 found POSSUM predictive value of 100% for mortality and 94% for morbidity, which were better than observed in this study. However, their POSSUM AUROCs for mortality (0.943) and morbidity (0.930) indicated lower accuracy compared to ours. Meanwhile, Shekar et al,4 reported that the AUROC values for mortality prediction were 0.818 by POSSUM and 0.836 by P-POSSUM, showing a higher accuracy than ours.
In a study conducted by Nag et al,5 comparing APACHE-II and P-POSSUM scores in predicting mortality in patients undergoing emergency laparotomy, the cutoff value of P-POSSUM to predict mortality was 63, which was higher than what was observed in this study, and the area under the ROC was 0.989, which suggested excellent diagnostic performance. However, in the study in Zimbabwe,12 AUROC for P-POSSUM-predicted mortality was 0.814, which was much lower compared to our study.
Despite minor variations, the results of the current study and others reinforce the high utility value of the POSSUM scoring system for preoperative risk prediction, enabling clinicians to identify patients at high risk for complications and mortality.
The limitations of this study included a small sample size, its single-center nature, and the relatively low economic status of the participants. Thus, our results may not be generalizable. This calls for future research involving larger and more diverse patient populations from different parts of India to further validate the predictive accuracy of POSSUM and P-POSSUM scores.
Conclusion
This study has found that the POSSUM and P-POSSUM scoring systems effectively predict morbidity and mortality in emergency gastrointestinal procedures with high sensitivity and specificity. Further research is needed to compare their prognostic accuracy in patients in other parts of India.
Disclosure
The authors declare no conflicts of interest. No funding was received for this study.
references
- 1. Takagi K, Umeda Y, Yoshida R, Nobuoka D, Kuise T, Fushimi T, et al. The outcome of complex hepato-pancreato-biliary surgery for elderly patients: a propensity score matching analysis. Dig Surg 2019;36(4):323-330.
- 2. Dutton J, Zardab M, De Braal VJ, Hariharan D, MacDonald N, Hallworth S, et al. The accuracy of pre-operative (P)-POSSUM scoring and cardiopulmonary exercise testing in predicting morbidity and mortality after pancreatic and liver surgery: a systematic review. Ann Med Surg (Lond) 2020 Dec;62:1-9.
- 3. Gunturi SR, Thumma VM, Sastry RA, Bheerappa N. Evaluation of POSSUM and P-POSSUM in pancreatic surgery. Int J Surg Sci 2019;3(3):98-104.
- 4. Shekar N, Debata PK, Debata I, Nair P, Rao LS, Shekar P. Use of POSSUM (physiologic and operative severity score for the study of mortality and morbidity) and portsmouth-POSSUM for surgical assessment in patients undergoing emergency abdominal surgeries. Cureus 2023 Jun;15(6):e40850.
- 5. Nag DS, Dembla A, Mahanty PR, Kant S, Chatterjee A, Samaddar DP, et al. Comparative analysis of APACHE-II and P-POSSUM scoring systems in predicting postoperative mortality in patients undergoing emergency laparotomy. World J Clin Cases 2019 Aug;7(16):2227-2237.
- 6. Eswaravaka S, Suhrid C, Rao B, Prabhakar S, Pandya J. Revisiting physiological and operative severity score for the enumeration of mortality and morbidity (POSSUM) and Portsmouth-POSSUM (P-POSSUM) scores: are they valid in cases of ileal perforation? Cureus 2024 Jul 30;16(7):e65733.
- 7. Garg R, Rustagi K. P-POSSUM for onco-surgeries: does one suit fits all! J Anaesthesiol Clin Pharmacol 2022;38(1):66-67.
- 8. Wanjiang F, Xiaobo Z, Xin W, Ye M, Lihua H, Jianlong W. Application of POSSUM and P-POSSUM scores in the risk assessment of elderly hip fracture surgery: systematic review and meta-analysis. J Orthop Surg Res 2022 May;17(1):255.
- 9. Echara ML, Singh A, Sharma G. Risk-adjusted analysis of patients undergoing emergency laparotomy using POSSUM and P-POSSUM score: a prospective study. Niger J Surg 2019;25(1):45-51.
- 10. Dindo D. The Clavien–Dindo classification of surgical complications. Treatment of postoperative complications after digestive surgery. 2014:13-17.
- 11. Yelamanchi R, Gupta N, Durga CK, Korpal M. Comparative study between P- POSSUM and Apache II scores in predicting outcomes of perforation peritonitis: prospective observational cohort study. Int J Surg 2020 Nov;83:3-7.
- 12. Ngulube A, Muguti GI, Muguti EG. Validation of POSSUM, P-POSSUM and the surgical risk scale in major general surgical operations in Harare: a prospective observational study. Ann Med Surg (Lond) 2019 Mar;41:33-39.
- 13. Sohail I, Jonker L, Stanton A, Walker M, Joseph T. Physiological POSSUM as an indicator for long-term survival in vascular surgery. Eur J Vasc Endovasc Surg 2013 Aug;46(2):223-226.
- 14. Hu ZW, Xin RQ, Xia YJ, Jia GP, Chen XX, Wang S. Application of POSSUM and P-POSSUM in surgical risk assessment of elderly patients undergoing hepatobiliary and pancreatic surgery. Clin Interv Aging 2020 Jul 12:1121-1128.
- 15. González-Martínez S, Martín-Baranera M, Martí-Saurí I, Borrell-Grau N, Pueyo-Zurdo JM. Comparison of the risk prediction systems POSSUM and P-POSSUM with the surgical risk scale: a prospective cohort study of 721 patients. Int J Surg 2016 May;29:19-24.
- 16. Chatterjee AS, Renganathan DN. POSSUM: a scoring system for perforative peritonitis. J Clin Diagn Res 2015 Apr;9(4):PC05-PC09.