Breast cancer is the most-diagnosed malignancy in females worldwide (11.6%) and the leading cause of death (6.9%) from all cancers, as reported by the World Health Organization in 2022.1 Breast cancers are subtyped based on the expression of estrogen receptors (ER), progesterone receptors (PR), and human epidermal growth factor receptor-2 (HER-2) which serve as key therapeutic targets for drug therapy. Breast cancers that lack all three types of receptors (ER, PR, and HER-2) are known as triple-negative breast cancers (TNBC). Due to the absence of these key receptors, there are currently no targeted treatments for TNBC.2
Among the few drugs with potential benefit for TNBC patients are platinum-based chemotherapeutic agents such as cis-diamminedichloroplatinum(II) (cisplatin or CDDP).3 Though a subset of TNBC patients are sensitive to cisplatin, its anticancer effects are limited due to emergence of chemoresistance, leading to therapeutic failure.4 Researchers have been attempting to understand the molecular pathways involved in TNBC’s resistance to chemotherapy. Our previous research, as well as others, have shown that TNBC cells can become resistant to cisplatin by several mechanisms, such as repairing the targeted cancer DNA via excision repair mechanisms and deregulation of proapoptotic or antiapoptotic proteins involved in the cell cycle.4–7 Targeting the deregulated apoptotic pathways to prevent the proliferation of TNBC cells represents a promising approach to overcoming their resistance to chemotherapy.
E2F-1 and Akt1 are two key proteins that play significant roles in the cell cycle and apoptosis and are frequently activated or deregulated in human cancers, including TNBC.
E2F-1, a member of a group of eight transcription factors, regulates cell cycle progression in normal cells but signals apoptosis in response to DNA damage.8 E2F-1-induced apoptosis in response to DNA-damaging agents can be both p53-dependent9 and p53-independent.10 E2F-1 has been found to be deregulated in various types of cancer cells, including breast cancer cells.10–12 Deregulated E2F-1 can lose its apoptotic ability in late-stage cancers, and instead promote tumor invasion and metastasis, mediating chemoresistance.13
Akt1, also known as protein kinase B, is a serine/threonine kinase and one of the three isoforms of the Akt family. It plays a key role in the phosphoinositide-3-kinase/Akt signaling pathway, which is involved in several aspects of cancer pathophysiology, especially tumor growth, survival, and invasiveness.14 Breast cancer is most associated with alterations in the phosphoinositide-3-kinase/Akt signaling pathway15 and exhibits resistance to chemotherapy.16 The three AKT isoforms (Akt1, Akt2, and Akt3) share high sequence and structural homology but have elicited cell and context-specific effects.17 In breast cancer, Akt-1 accelerates cell proliferation but suppresses metastasis.16,17 Therefore, targeting Akt isoform-specific signaling is crucial for successful cancer therapy.
Hallstrom et al,18 reported the existence of a regulated relationship between E2F-1 and Akt during normal cellular proliferation, where Akt protein kinase specifically blocks the expression of genes in the E2F-1 apoptotic program. They concluded that the E2F and Akt connection could explain how normal cycling cells survive the transition from the G1 phase to the S phase of the cell cycle.18 Chaussipied and Ginsberg,19 identified a negative feedback loop between E2F and Akt in malignant melanoma cells. E2F-1 upregulates Akt activity through Gab2, and the sustained E2F-1/Gab2/Akt pathway, in turn, inhibits E2F-1 via TopBp1, preventing E2F-1 from exerting its proapoptotic functions.19 These two studies have revealed a crosstalk between E2F-1 and Akt, suggesting a dynamic relationship between cytoplasmic and nuclear signaling cascades.
However, the interaction between E2F-1 and Akt1 in the context of cisplatin sensitivity in TNBC has not yet been studied. Therefore, this study aims to detect the interaction between E2F-1 and Akt1 and determine whether their interaction influences TNBC sensitivity to cisplatin-induced apoptosis.
Methods
To model the TNBC conditions in vitro, we used the MDA-MB-231 cell line purchased from the Pasteur Institute in Iran. (We used the same product for our previous study.20) Once received, the cell line was maintained in Dulbecco’s Modified Eagle Medium (DMEM) supplemented with 10% fetal bovine serum and 1% antibiotic-antimycotic solution (all from Gibco, Thermo Fisher Scientific, UK). Then, the cells were maintained at 37 °C in a humidified atmosphere containing 5% carbon dioxide. We also conducted experiments with treated and untreated controls using cells from the same source.
FlowCellect Annexin Red Kit (Millipore, Germany) was used to quantify live and apoptotic MDA-MB-231 cells after treatment with cisplatin. The cells were prepared in an assay buffer at a volume of 100 μL and pipetted into appropriate wells, to which 100 μL of Annexin V working solution was added and incubated at 37 °C for 15 minutes. Following the incubation, 5 μL of 7-aminoactinomycin D was added to each well. Thereafter, the cells were incubated again in the dark at room temperature for 5 minutes. Finally, acquisition and analysis were performed using Guava® InCyte and GuavaSuite Software (Merck KGaA, Germany).
Both live and apoptotic MDA-MB-231 cells were determined by morphological features using Hoechst 33258 dye (6.25 ng/mL) (Sigma-Aldrich, Germany), as described previously.20 At least 400 cells per treatment group were selected blindly and counted randomly. The cells were visualized using a Nikon ECLIPSE Ti-BTV2 fluorescent microscope.
Protein extraction and western blot were performed as described previously.20 Briefly, the membranes were incubated overnight at 4 °C with primary antibodies and detected with horseradish peroxidase-conjugated goat Immunoglobulin G (IgG) (Cell Signaling Technology, USA) raised against the corresponding species. Subsequently, the peroxidase activity was visualized with the West Dura Detection Kit, an enhanced chemiluminescence (ECL) kit (West Dura Detection Kit, Thermo Scientific, UK). The signal was captured using a GBox machine with a GeneSys software version 1.8.11 (GeneSys Telecommunications Labs Inc., USA). Finally, the signal intensity was determined densitometrically using Image J software, version 1.47 (The National Institutes of Health, USA).
Cells grown on 12-well glass slides were treated with graded concentrations of cisplatin (0, 20, and 40 μM) for 24 hours. Immunofluorescence staining was applied as previously described.7 Briefly, cells were fixed by precooled (-20 °C) methanol for 3 minutes. Then, the cells were permeabilized for 5 minutes with 0.05% Triton X-100. After washing with phosphate-buffered saline (PBS), the cells were blocked with 1% Bovine Serum Albumin for 30 minutes at 4 °C, washed again and incubated with (1:100) primary antibodies (Cell Signaling Technology, USA) for 1 hour at room temperature. After the PBS wash, fluorescein-conjugated secondary antibodies (Fisher Scientific, UK) were added (1:400) for 1 hour at room temperature. The PBS washing was performed again before mounting.
Imaging was performed using a Nikon ECLIPSE fluorescence microscope, at 20× magnification. The fluorescence intensity of each protein for each group was determined per cell number in a specified field using ImageJ software. The shown compartments were the cytoplasm and the nucleus of each cell. The merged images were automatically generated by channel merge option in the Nikon NIS Element software. The acquired images of Akt1 and E2F-1 were merged. The overlay of the red fluorescent color of E2F-1 with the green fluorescent color of Akt1 produced a yellowish-to-orangish fluorescent color, representing the colocalization of both proteins. After obtaining the merged image, the color intensity of 100 cells in each treatment was calculated using ImageJ software.
After treatment of MDA-MB-231 with cisplatin, protein of interest was immunoprecipitated as previously described.7 Briefly, protein lysates were pre-cleared by incubation with 20 μL of protein G agarose bead and 1 μg of goat monoclonal IgG antibody for 1 hour at 4 °C (all from Cell Signaling Technology, USA). The mixture was centrifuged at 3600 × g for 1 minute. Pre-cleared supernatant was incubated overnight at 4 °C with 20 μL of agarose beads and 1 μg of anti-E2F-1 rabbit monoclonal antibody or rabbit IgG isotype. After five washes with lysis buffer, SDS-loading buffer was added. The precipitated proteins were detected by western blot.
MDA-MB-231 cells, seeded in a 12-well slide and treated with cisplatin, were fixed with 10% neutral buffered formalin for 30 minutes. Then, the cells were rehydrated through graded alcohols. After washing with distilled water, hematoxylin stain was added for 10 minutes. Differentiation was performed in 1% acid alcohol for a few dips. Washing in running tap water for 5 minutes was followed by adding 1% eosin solution for 4 minutes. The cells were rapidly dehydrated and cleared, and then mounted with dibutylphthalate polystyrene xylene.
The cells, cultured on coverslips and treated with cisplatin, were visualized by scanning electron microscopy (SEM) as described previously.6 Briefly, the cells were fixed in 2.5% glutaraldehyde in sodium cacodylate buffer (1 M, pH 7.3) for 10 minutes. After washing with 1 M sodium cacodylate for 2 minutes, 1% osmium tetroxide (Agar Scientific, UK) was used to postfix the cells for 5 minutes, followed by a rapid wash in distilled water. The cells were then dehydrated in ethanol series (25%, 50%, 70%, 95%, 100%), 1 minute in each, and dried using hexamethyldisilane (Sigma-Aldrich, USA). Thereafter, the cells were mounted on aluminum stubs, coated with gold particles to prevent electrical charge effects, and scanned using SEM (JEOL JSM-5600LV, JOEL Ltd, Japan).
Means and SD were calculated and analyzed by an independent t-test or a single-factor analysis of variance using SPSS Statistics (IBM Corp. Released 2023. IBM SPSS Statistics for Windows, Version 29.0 Armonk, NY: IBM Corp) and Microsoft Excel. Statistical significance was set at p < 0.05.
Both biochemical and morphological aspects of apoptosis in MDA-MB-231 cells were studied after pretreating them with cisplatin. Different concentrations were used to determine the optimum dose of cisplatin that could produce significant apoptosis without cytotoxicity.21
Results
Exposing the MDA-MB-231 cell culture to varying concentrations of cisplatin at 10, 20, and 40 μM for 24 hours resulted in a significant dose-dependent increase in apoptosis in comparison to untreated control cells [Figure 1]. To determine whether cisplatin-induced cytotoxicity was due to the induction of apoptosis in MDA-MB-231 cells, the level of associated apoptotic enzyme—poly (ADP-ribose) polymerase (PARP)— was detected by western blot. PARP, a DNA-binding enzyme that can detect DNA strand breaks, is a substrate that is cleaved by both caspase-3 and caspase-7.22 The presence of cleaved PARP is a commonly used diagnostic tool to detect apoptosis in many cell types.22 As shown by the western blot in Figure 1a, PARP cleavage showed that the PARP protein was degraded, generating a concomitant diminution of full size (116 KD) molecule and accumulation of the 85 KD in MDA-MB-231 cells treated with cisplatin at 20 and 40 μM after 24 hours. These results provided convincing evidence of the induction of apoptosis in cisplatin-treated cells.
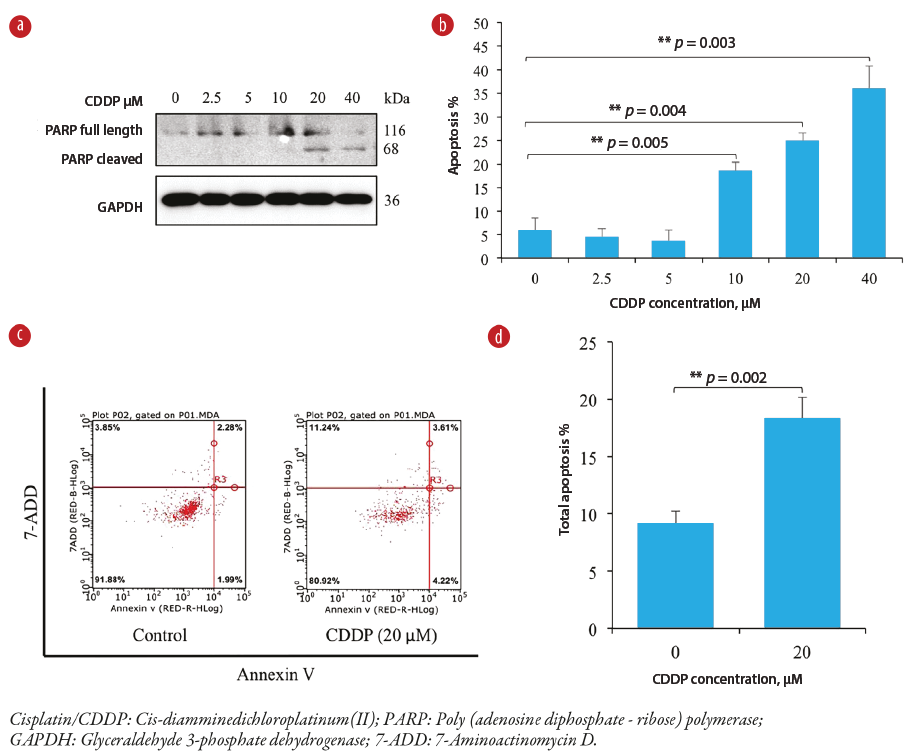 Figure 1: Cisplatin-induced apoptosis in a concentration-dependent manner in MDA-MB-231 cells. (a) The effect of cisplatin on PARP expression (full length and cleaved) in MDA-MB-231 cells as analyzed by a western blot. (b) Graphical presentation of estimated apoptosis percentage by the Hoechst stain method in MDA-MB-231 cells. Note the highly significant increases in apoptosis at higher cisplatin concentrations (p < 0.005) compared to the untreated control sample. (c) Dot graphs show flow-cytometric analysis of apoptosis following treatment of MDA-MB-231 cells with a cisplatin concentration of 20 μM compared to the control sample. (d) Bar graph of quantitative flow cytometry results showing a significant (p = 0.002) increase in apoptosis at a cisplatin concentration of 20 μM compared to the control sample.
To further confirm that cisplatin induces apoptosis in MDA-MB-231 cells, flow cytometry analysis with Annexin V conjugated with fluorescein isothiocyanate and 7-aminoactinomycin D double staining was used. Figure 1c indicates that MDA-MB-231 cells treated with cisplatin at 20 μM for 24 hours demonstrated approximately 20% apoptosis.
To further examine morphological changes, the treated cells were stained with hematoxylin and eosin. The control cells exhibited normal nuclear morphology—round, homogeneous, and stained dark blue. In contrast, cells treated with cisplatin 20 μM for 24 hours exhibited typical characteristics of apoptosis, with condensed and fragmented nuclei, also staining dark blue [Figure 2].
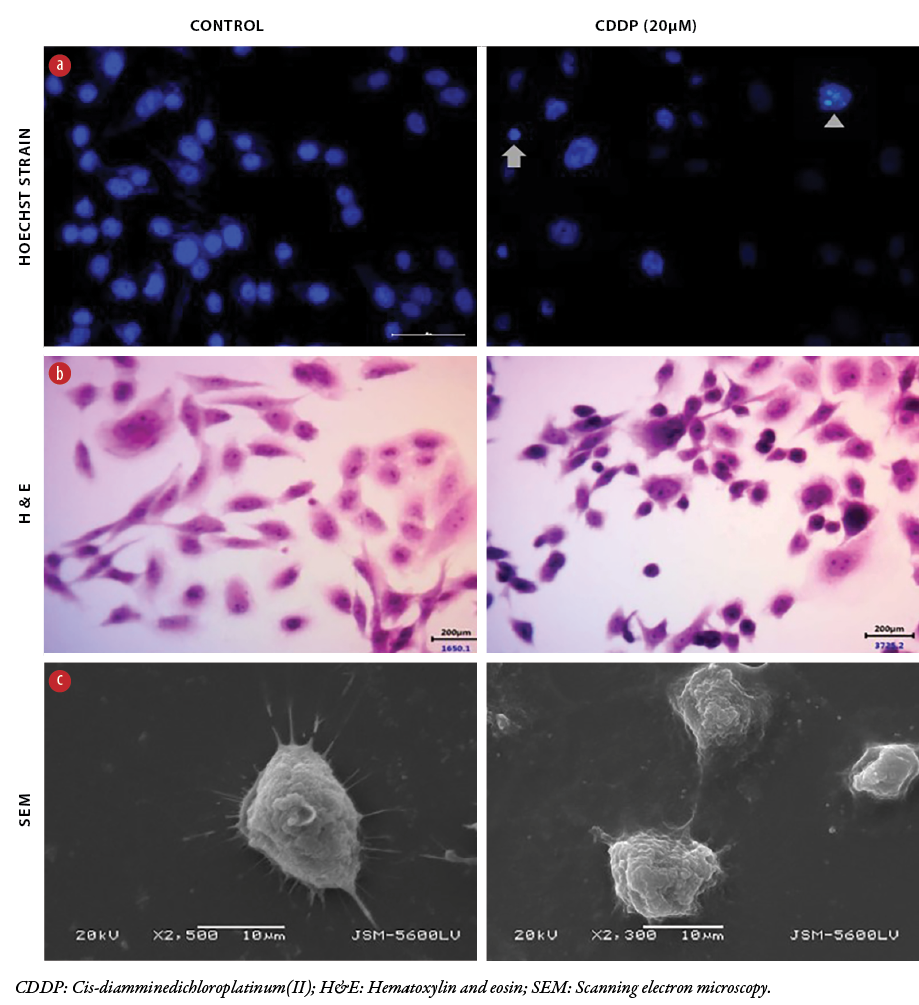 Figure 2: Morphological changes in MDA-MB-231 cells caused by cisplatin. Representative morphology of MDA-MB-231 cells following cisplatin treatment. (a) Hoechst-stained cells show apoptotic features, pyknotic (arrow) and fragmented (arrow head) nuclei compared to a live cell nucleus. (b) H&E-stained cells show shrinkage of cytoplasm and nuclear pyknosis compared to untreated cells. (c) SEM micrographs of cisplatin-treated cells with shrinkage of lamellipodia, surface pores and grooves compared to untreated cells. Images stained with Hoechst and H&E were captured at 40x magnification, while SEM micrographs were screened at 2–5µM.
The treated cells were also examined by SEM in order to reveal cell blebbing and fragmentation. At the concentration of 20 μM of cisplatin, SEM revealed shrunken and round-shaped cells with shrinkage of lamellipodia, membrane blebs, and apoptotic bodies compared to untreated cells that showed higher numbers and thicker membrane-bound protrusions and lamellipodia [Figure 2].
Three experimental techniques were used to detect and characterize the morphology of MDA-MB-231 cells in response to cisplatin-induced apoptosis. As shown in Figure 2, Hoechst staining, which correlated with the presence of cells with typical apoptotic nuclear morphology (pyknotic and fragmented nuclei), was present in the cells treated with 20 μM for 24 hours, but not in the untreated cells.
Since the activation of caspases is a hallmark of apoptosis, the cellular compartmentalization of the cleaved nuclear protein, caspase-3, in MDA-MB-231 cells treated with cisplatin 20 μM was assessed using immunofluorescence microscopy. The 4’,6-diamidino-2-phenylindole nuclear staining showed morphological changes in terms of both nuclear condensation and cell structure loss and significant expression of cleaved caspase-3 in treated cells compared to control cells [Figure 3]. Together, these results indicate apoptotic activity of cisplatin in MDA-MB-231 cells.
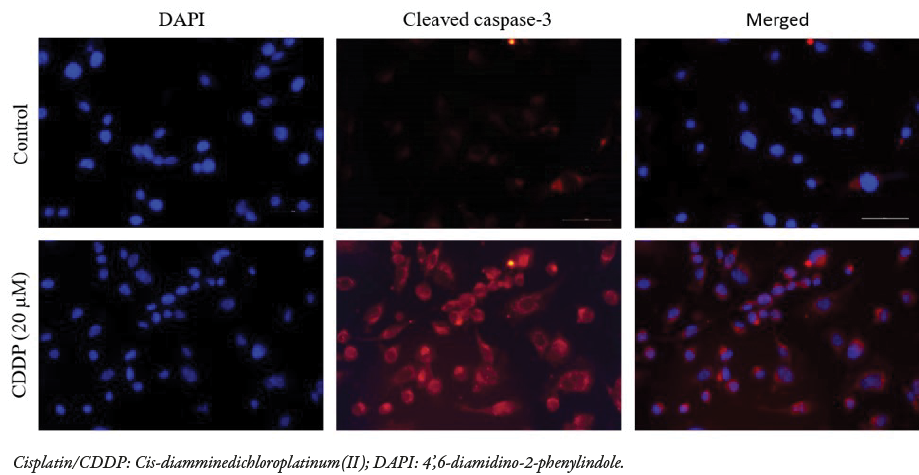 Figure 3: Immunofluorescence staining of cleaved caspase-3 in MDA-MB-231 cells following cisplatin treatment at 20 μM shows an increase in expression (top row) compared to untreated cells (bottom row). Cisplatin-treated cells have activated the caspase-3 protein via its cleaved form. The DAPI stain was used for nuclear staining in both samples. All images were captured at 40x magnification, and the merged images were automatically generated using a fluorescence microscope. The compartments show the cytoplasm and the nucleus of each cell.
To determine whether cisplatin has a differential effect on E2F-1 and Akt1 in MDA-MB-231 cells, the expressions of these two proteins were investigated. Western blot analysis revealed that cisplatin treatment increased the expression of E2F-1 contents and decreased that of Akt1 in a dose-dependent manner ( 20–40 μM; 24 hr) compared to untreated cells. This led us to speculate that these two endogenous proteins may be colocalizing and interacting in MDA-MB-231 cells.
To explore this possibility, E2F-1 and Akt-1 colocalization and interaction were examined in control cells and cisplatin-treated cells (20 and 40 μM; 24 hr) using immunofluorescence. Immunofluorescence analysis detected E2F-1 immunosignal in both the cytoplasm and the nucleus with approximately equal intensities in the untreated control cells. The Akt1 immunoreactivity signals were mainly located in the cytoplasm compared to the nucleus. With cisplatin treatment, E2F-1 immunoreactivity increased and became more localized in the nucleus in a concentration-dependent manner [Figure 4]. Conversely, cisplatin had no effect on the localization of Akt1, whose immunosignal intensity still remained high in the cytoplasm, but a low immunoreactivity in the nucleus was still detectable. Merging E2F-1 and Akt1 immunosignals in cisplatin-treated cells demonstrated a co-localization of immunosignals in clusters and with increased intensity in the cytoplasm [Figure 4]. Thus, differential colocalization of both proteins in this cell line could be the precursor for the cisplatin-induced apoptosis. One-way analysis of variance of the three independent experiments indicated significance (*p = 0.016, **p = 0.006, #p = 0.014 ) [Figure 4b].
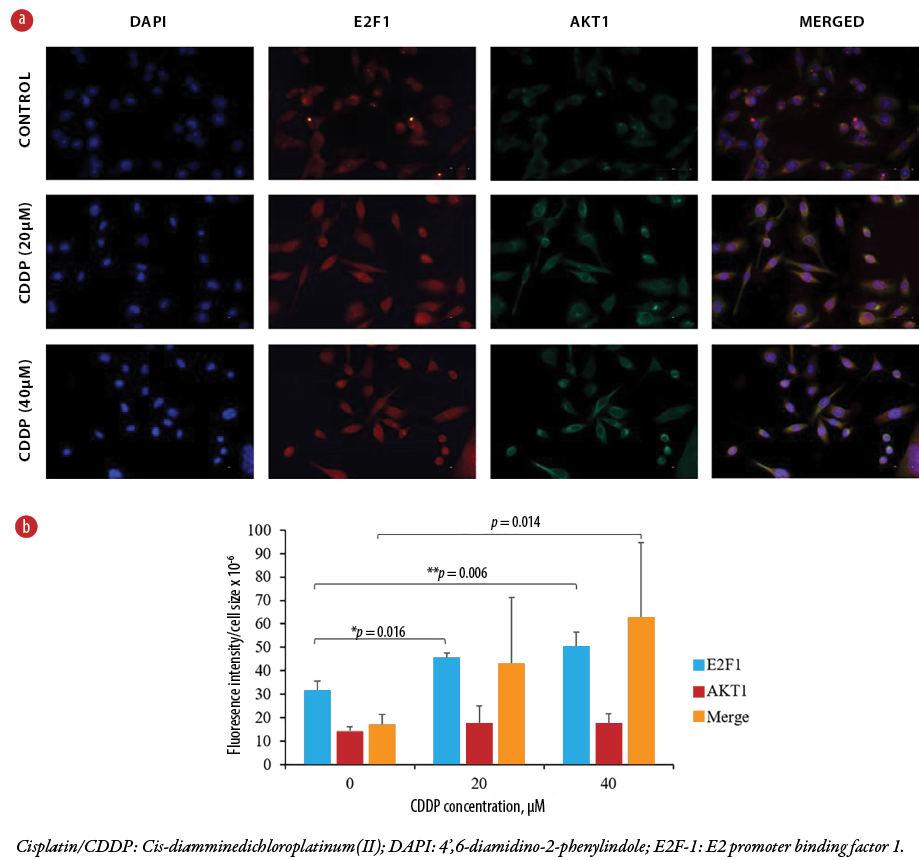 Figure 4: (a) Immunofluorescent microscopy images of control MDA-MB-231cells (top row) and cisplatin-enhanced MDA-MB-231 cells (middle and bottom rows). The shown compartments represent the cytoplasm and the nucleus of each cell. DAPI stain was used as a control for nuclear staining. Images represent three independent experiments, each captured at 40 × magnification. (b) The bar graph shows changes in estimated intensities of E2F-1, Akt1, and merged cells in MDA-MB-231 cells following cisplatin treatment. The scattered dots represent the mean of 10 cells per field, counted from 10 fields per replicate for each treatment, resulting in a total of 100 counted cells.
To further validate the interaction of the two endogenous proteins, the E2F-1-Akt1 interaction was examined by immunoprecipitation. We chose to precipitate E2F-1 and detect the possible co-precipitation of Akt1 because cisplatin increased its expression in these cells, unlike Akt1, as indicated in Figure 5. A western blot revealed that Akt1 successfully coprecipitated with E2F-1 in both control and treated cells, depending on the cisplatin concentration, indicating a potential interaction of both proteins at the endogenous level of MDA-MB-231 cells [Figure 6].
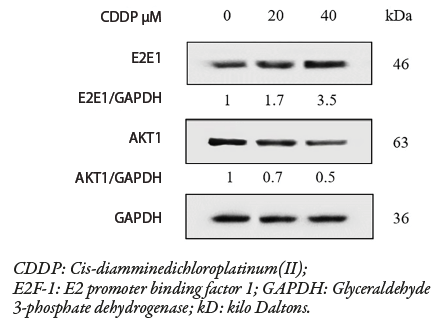 Figure 5: Immunoblotting reveals the effect of cisplatin at varying concentrations (20 and 40 μM) on E2F-1 and Akt1 expressions in MDA-MB-231 cells. The blots show an increase in E2F-1 and a decrease in Akt1 when treated with graded concentrations of cisplatin (20 and 40 μM ; 24 hr). GAPDH was used as a loading control to normalize both E2F-1 and AKT1 proteins.
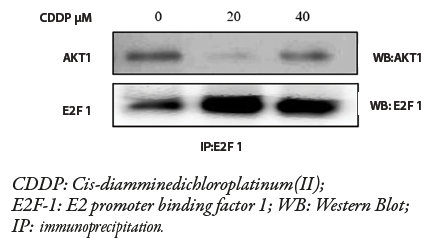 Figure 6: Coimmunoprecipitation assay shows the interaction between E2F-1 and Akt1 after cisplatin treatment at graded concentrations (20 and 40 μM ; 24 hr) on MDA-MB-231 cells.
Figure 6 shows how cisplatin increased E2F-1 and Akt1 interaction in MDA-MB-231 cells. A western blot shows immunoprecipitation result. E2F-1 and Akt1 were successfully co-precipitated by anti-E2F-1 antibody in MDA-MB-231 cells treated with graded cisplatin concentrations (20 and 40 μM; 24 hr). E2F-1 and Akt1 binding was noticed in both controlled and treated groups, in which such binding was enhanced by the different concentrations of cisplatin. The experiment was triplicated, and the presented results are from a representative replicate.
Discussion
In this study, we have demonstrated that MDA-MB-231 breast cancer cells respond to cisplatin by inducing apoptosis. We have also found that the interaction between E2F-1 and Akt1 in cisplatin-treated MDA-MB-231 cells is likely activating the apoptosis. To our knowledge, this is the first report to examine the interaction between E2F-1 and Akt1 in cisplatin-induced apoptosis in TNBC.
In our previous study, we described how platinum-based drugs such as cisplatin affect the ultrastructure of breast cancer cell types.6 We also revealed (based on scanning electron microscopy and transmission electron microscopy data) apoptosis as the major mechanism for cell death.6 Those findings were consistent with other studies, which detected apoptosis in the MDA-MB-231 cell line21,23,24 and other cancer cell lines25–27 following exposure to cisplatin.
In the current study, MDA-MB-231 cells were selected for four main reasons. First, they represent the TNBC-resistant cell line of the basal-like subtype, which lack the three receptors (ER, PR, and HER-2).28 Second, this cell line is more difficult to treat due to lack of viable therapy targets.29 Third, mutations in the p53 protein are observed in more than 50% of all human cancers,30 and MDA-MB-231 cells are known to harbor mutant p53.31 Fourth, cisplatin is a potential treatment option for TNBC either alone or in combination with other drug agents.3
Our findings provide evidence that cisplatin induces apoptosis in a p53-independent pathway, rendering MDA-MB-231 cells vulnerable to death via an E2F-1 apoptotic pathway, as mutations in E2F-1 are very rare in cancer cells.32 It is also suggested that E2F-1 may preferentially induce apoptosis in breast and ovarian cancer cells that have mutations in p53.11
In this study, cisplatin reproducibly induced apoptosis in a dose-dependent manner (10, 20, and 40 μM; 24 hr). Apoptosis was detected by two distinct methods — biochemical and morphological — in MDA-MB-231 cells treated with 20 μM dose of cisplatin, as this concentration effectively induced the cleavage of PARP. These results align with other studies that have shown that lower doses of cisplatin (range = 20–100 μM) result in apoptosis of MDA-MB-231 cells.23,24 Apoptosis in 20 μM cisplatin-treated cells was further confirmed biochemically by caspase-3 activation and flow cytometric analysis. The results of morphological studies using three different methods, Hoechst stain, hematoxylin and eosin stain, and SEM, altogether revealed and further validated the differential structural changes typical of apoptosis.
Given the role of E2F-1 in crosstalk with the PI3-K /Akt pathway, it was of interest to evaluate whether a relationship exists between E2F-1 and Akt1 expression levels in response to cisplatin and to detect their interaction in TNBC. We observed an inverse relationship between increased E2F-1 and decreased Akt1 expression levels in response to cisplatin in a dose-dependent manner in this cell line. Cisplatin has been shown to induce a substantial increase in endogenous E2F-1 protein levels, enhancing apoptosis in other cancer cell lines that lack p53.33 Consistent with our observations, increasing concentration of cisplatin (0.1 to 50 μg/mL) was found to have no effect on Akt in MDA-MB-231 cells.34 The fact that cisplatin differentially affected E2F-1 and Akt1 protein expression levels points to the existence of an E2F-1-Akt1 interaction, which in turn could be the precursor for a cisplatin-induced apoptosis in TNBC. Exposure to cisplatin had no effect on Akt1 localization; however, E2F-1 protein immunosignal intensity increased in the nucleus, a compartment consistent with its defined role in DNA repair.35 Furthermore, an induced accumulation of E2F-1 protein by several DNA-damaging chemotherapeutic drugs has been observed in a variety of tumor cell lines independent of p53 and pRb.36 Interestingly, our results revealed that the elevated intensity of both proteins in the cytoplasm in response to cisplatin suggests that they are interacting in the cytoplasm.
This study is the first to document subcellular localization and interaction between E2F-1 and Akt1 in TNBC exposed to cisplatin. We observed Akt1 predominantly in the cytoplasm in the MDA-MB-231 cell line, and as found in previous studies, which also detected Akt1 in other cell lines that lack p53.37 Ivanova et al,38 demonstrated that E2F-1 can shuttle into and out of the nucleus in a variety of cell types. Yu et al,39 showed that cisplatin cytotoxicity, apart from inducing nuclear independent apoptosis, can also initiate apoptosis by cytoplasmic events such as cytoplasmic cdk2. E2F-1, a downstream component of Akt119 and E2F-1, has been described to have nuclear-independent apoptotic functions in cisplatin cytotoxicity.40 It is possible that the subcellular localization of E2F-1 in the cytoplasm and its potential interaction with Akt1 may contribute to determining the cell fate by overcoming chemoresistance. Based on the ability of anti-E2F-1 antibody to immunoprecipitate Akt1, it is evident that E2F-1 and Akt1 physically associate in TNBC.
Conclusion
This study provides evidence of E2F-1 and Akt1 interaction through immunofluorescence by their colocalization in the cytoplasm in response to cisplatin. In addition, immunoprecipitation demonstrated that such interaction is involved in cisplatin-induced apoptosis, thus aiding in the chemosensitivity of TNBC. Further exploration is needed to determine whether such interaction occurs directly or via an intermediate protein. It is also important to manipulate their expression to confirm that such interaction is required for cisplatin to exert its effect in these cells.
Disclosure
The authors declare no conflict of interest. This work was funded by a grant from College of Medicine and Health Sciences, Sultan Qaboos University (Grant No. IG/MED/PATH/14/01). Ethical approval was not required for this study as only commercial secondary cell lines were used. The abstract of this article has been previously presented at the World Cancer Congress 2022 under Theme 2 Cancer research and progress.
Acknowledgements
The authors would like to thank staff of the Electron Microscopy Unit, Department of Pathology, Sultan Qaboos University Hospital, for their expert assistance in SEM techniques.
references
- 1. Bray F, Laversanne M, Sung H, Ferlay J, Siegel RL, Soerjomataram I, et al. Global cancer statistics 2022: GLOBOCAN estimates of incidence and mortality worldwide for 36 cancers in 185 countries. CA Cancer J Clin 2024;74(3):229-263.
- 2. Denkert C, Liedtke C, Tutt A, von Minckwitz G. Molecular alterations in triple-negative breast cancer-the road to new treatment strategies. Lancet 2017 Jun;389(10087):2430-2442.
- 3. Jhan J-R, Andrechek ER. Triple-negative breast cancer and the potential for targeted therapy. Pharmacogenomics 2017 Nov;18(17):1595-1609.
- 4. Nedeljković M, Damjanović A. Mechanisms of chemotherapy resistance in triple-negative breast cancer-how we can rise to the challenge. Cells 2019 Aug;8(9):957.
- 5. Galluzzi L, Senovilla L, Vitale I, Michels J, Martins I, Kepp O, et al. Molecular mechanisms of cisplatin resistance. Oncogene 2012 Apr;31(15):1869-1883.
- 6. Al-Bahlani S, Al-Dhahli B, Al-Adawi K, Al-Nabhani A, Al-Kindi M. Platinum-based drugs differentially affect the ultrastructure of breast cancer cell types. Biomed Res Int 2017;2017:3178794.
- 7. Al-Bahlani S, Fraser M, Wong AY, Sayan BS, Bergeron R, Melino G, et al. P73 regulates cisplatin-induced apoptosis in ovarian cancer cells via a calcium/calpain-dependent mechanism. Oncogene 2011 Oct;30(41):4219-4230.
- 8. DeGregori J, Johnson DG. Distinct and overlapping roles for E2F family members in transcription, proliferation and apoptosis. Curr Mol Med 2006 Nov;6(7):739-748.
- 9. Wu X, Levine AJ. p53 and E2F-1 cooperate to mediate apoptosis. Proc Natl Acad Sci U S A 1994 Apr;91(9):3602-3606.
- 10. Sun B, Wingate H, Swisher SG, Keyomarsi K, Hunt KK. Absence of pRb facilitates E2F1-induced apoptosis in breast cancer cells. Cell Cycle 2010 Mar;9(6):1122-1130.
- 11. Hunt KK, Deng J, Liu TJ, Wilson-Heiner M, Swisher SG, Clayman G, et al. Adenovirus-mediated overexpression of the transcription factor E2F-1 induces apoptosis in human breast and ovarian carcinoma cell lines and does not require p53. Cancer Res 1997 Nov;57(21):4722-4726.
- 12. Meng P, Ghosh R. Transcription addiction: can we garner the Yin and Yang functions of E2F1 for cancer therapy? Cell Death Dis 2014 Aug;5(8):e1360.
- 13. Pützer BM, Engelmann D. E2F1 apoptosis counterattacked: evil strikes back. Trends Mol Med 2013 Feb;19(2):89-98.
- 14. Cicenas J. The potential role of Akt phosphorylation in human cancers. Int J Biol Markers 2008;23(1):1-9.
- 15. Massihnia D, Galvano A, Fanale D, Perez A, Castiglia M, Incorvaia L, et al. Triple negative breast cancer: shedding light onto the role of pi3k/akt/mtor pathway. Oncotarget 2016 Sep;7(37):60712-60722.
- 16. Li W, Hou JZ, Niu J, Xi ZQ, Ma C, Sun H, et al. Akt1 inhibition promotes breast cancer metastasis through EGFR-mediated β-catenin nuclear accumulation. Cell Commun Signal 2018 Nov;16(1):82.
- 17. Hinz N, Jücker M. Distinct functions of AKT isoforms in breast cancer: a comprehensive review. Cell Commun Signal 2019 Nov;17(1):154.
- 18. Hallstrom TC, Mori S, Nevins JR. An E2F1-dependent gene expression program that determines the balance between proliferation and cell death. Cancer Cell 2008 Jan;13(1):11-22.
- 19. Chaussepied M, Ginsberg D. Transcriptional regulation of AKT activation by E2F. Mol Cell 2004 Dec;16(5):831-837.
- 20. Al-Bahlani S, Al-Lawati H, Al-Adawi M, Al-Abri N, Al-Dhahli B, Al-Adawi K. Fatty acid synthase regulates the chemosensitivity of breast cancer cells to cisplatin-induced apoptosis. Apoptosis 2017 Jun;22(6):865-876.
- 21. Pauzi AZ, Yeap SK, Abu N, Lim KL, Omar AR, Aziz SA, et al. Combination of cisplatin and bromelain exerts synergistic cytotoxic effects against breast cancer cell line MDA-MB-231 in vitro. Chin Med 2016 Nov;11:46.
- 22. Bressenot A, Marchal S, Bezdetnaya L, Garrier J, Guillemin F, Plénat F. Assessment of apoptosis by immunohistochemistry to active caspase-3, active caspase-7, or cleaved PARP in monolayer cells and spheroid and subcutaneous xenografts of human carcinoma. J Histochem Cytochem 2009 Apr;57(4):289-300.
- 23. Zhang Y, Wang L, Gao P, Sun Z, Li N, Lu Y, et al. ISL1 promotes cancer progression and inhibits cisplatin sensitivity in triple-negative breast cancer cells. Int J Mol Med 2018 Nov;42(5):2343-2352.
- 24. Li S, Li Q, Lü J, Zhao Q, Li D, Shen L, et al. Targeted inhibition of miR-221/222 promotes cell sensitivity to cisplatin in triple-negative breast cancer MDA-MB-231 cells. Front Genet 2019;10.
- 25. Mandic A, Hansson J, Linder S, Shoshan MC. Cisplatin induces endoplasmic reticulum stress and nucleus-independent apoptotic signaling. J Biol Chem 2003 Mar;278(11):9100-9106.
- 26. Chen W, Yang Y, Chen B, Lu P, Zhan L, Yu Q, et al. MiR-136 targets E2F1 to reverse cisplatin chemosensitivity in glioma cells. J Neurooncol 2014 Oct;120(1):43-53.
- 27. Swift LH, Golsteyn RM. Cytotoxic amounts of cisplatin induce either checkpoint adaptation or apoptosis in a concentration-dependent manner in cancer cells. Biol Cell 2016 May;108(5):127-148.
- 28. Cailleau R, Young R, Olivé M, Reeves WJ Jr. Breast tumor cell lines from pleural effusions. J Natl Cancer Inst 1974 Sep;53(3):661-674.
- 29. Prabhakaran P, Hassiotou F, Blancafort P, Filgueira L. Cisplatin induces differentiation of breast cancer cells. Front Oncol 2013 Jun;3:134.
- 30. Hainaut P, Hollstein M. p53 and human cancer: the first ten thousand mutations. Adv Cancer Res 2000;77:81-137.
- 31. Olivier M, Eeles R, Hollstein M, Khan MA, Harris CC, Hainaut P. The IARC TP53 database: new online mutation analysis and recommendations to users. Hum Mutat 2002 Jun;19(6):607-614.
- 32. Poppy Roworth A, Ghari F, La Thangue NB. To live or let die - complexity within the E2F1 pathway. Mol Cell Oncol 2015 Jan;2(1):e970480.
- 33. O’Connor DJ, Lu X. Stress signals induce transcriptionally inactive E2F-1 independently of p53 and Rb. Oncogene 2000 May;19(20):2369-2376.
- 34. Johnson-Holiday C, Singh R, Johnson EL, Grizzle WE, Lillard JW Jr, Singh S. CCR9-CCL25 interactions promote cisplatin resistance in breast cancer cell through Akt activation in a PI3K-dependent and FAK-independent fashion. World J Surg Oncol 2011 May;9(1):46.
- 35. Guo R, Chen J, Zhu F, Biswas AK, Berton TR, Mitchell DL, et al. E2F1 localizes to sites of UV-induced DNA damage to enhance nucleotide excision repair. J Biol Chem 2010 Jun;285(25):19308-19315.
- 36. Lin W-C, Lin F-T, Nevins JR. Selective induction of E2F1 in response to DNA damage, mediated by ATM-dependent phosphorylation. Genes Dev 2001 Jul;15(14):1833-1844.
- 37. Santi SA, Lee H. The Akt isoforms are present at distinct subcellular locations. Am J Physiol Cell Physiol 2010 Mar;298(3):C580-C591.
- 38. Ivanova IA, Vespa A, Dagnino L. A novel mechanism of E2F1 regulation via nucleocytoplasmic shuttling: determinants of nuclear import and export. Cell Cycle 2007 Sep;6(17):2186-2195.
- 39. Yu F, Megyesi J, Price PM. Cytoplasmic initiation of cisplatin cytotoxicity. Am J Physiol Renal Physiol 2008 Jul;295(1):F44-F52. PubMed.
- 40. Bell LA, O’Prey J, Ryan KM. DNA-binding independent cell death from a minimal proapoptotic region of E2F-1. Oncogene 2006 Sep;25(41):5656-5663.