Placenta accreta spectrum (PAS) is characterized by abnormal adhesion of the placenta, which can be subdivided into three types based on the degree of invasion into myometrium and extrauterine structures: accreta, increta, and percreta. This pathology often causes massive bleeding during delivery, leading to uterine rupture before delivery and adverse neonatal outcomes.1,2 Importantly, this catastrophic hemorrhage increases the maternal mortality rate during pregnancy.3 Cesarean hysterectomy is necessary in some cases, as the success rate of conservative uterine surgery varies depending on available resources and the surgeon’s skill.4,5 The PAS incidence is approximately 1.1% and is rapidly increasing due to the high rate of cesarean deliveries and the widespread use of assisted reproductive technology.6,7
In multiple prior cesarean scars and placenta previa, the incidence of PAS is higher.1,8,9 PAS disorders can also present unexpectedly in pregnant women with a lower risk of PAS development, which may be detected by antenatal ultrasound (US) screening.10,11 PAS disorders have also been documented in women with unscarred uteri.12,13
Using imaging modalities for prenatal diagnosis of severe PAS can help prevent adverse maternal and fetal outcomes and guide surgical intervention decisions, such as hysterectomy or uterine-preserving surgery.14,15 The PAS scoring system helps stratify patients into low-, intermediate-, and high-risk categories for placenta accreta.16 Early diagnosis and timely management significantly reduce estimated blood loss (EBL), prevent maternal death during labor, and increase the success rate of conservative management.8,17 PAS disorders can be detected by various imaging modalities as early as the first trimester.6,18
In women with low-lying or placenta previa and previous cesarean section (CS) scars, US scanning helps diagnose PAS with a sensitivity (Se) and specificity (Sp) of 87.03% and 86.34%, respectively.19 According to several studies, ultrasonography is superior to magnetic resonance imaging (MRI) and sufficient for PAS diagnosis, limiting MRI to cases that require surgical planning.20,21 Likewise, the interobserver agreement remains suboptimal for both modalities.14 US, as the primary imaging tool, may miss PAS when the placenta is located at the posterior site or the pregnant woman has no previous uterine scar.6 Consequently, the inaccurate evaluations of abnormal placentation places the obstetricians in an emergency situation, and patients in critically life-threatening conditions due to inadequate preparation. Kolak et al,22 recently emphasized that interpreting US signs based on the Sargent model's findings may be difficult to apply universally. Hence, the development of new predictive models for PAS in US is a critical concern.
For suspected cases on US, MRI can increase the diagnostic value of PAS. This imaging method accurately evaluates the depth of invasion, the involvement of surrounding structures, and the topography of placental invasion.23–25 Fiocchi et al,24 reported that MRI showed 100% Se (95% CI: 75.3–100.0) and 92.3% Sp (95% CI: 64.0–100.0) in diagnosing invasive placentation, with similar evidence shown by various studies.23
However, the MRI value in low- and middle-income countries remains unknown due to limited resources. This study primarily aimed to reveal the features and additional role of MRI in PAS assessment before surgery. A secondary aim is to evaluate clinical outcomes following imaging modalities at our tertiary center.
Methods
This retrospective cross-sectional study was conducted between January 2017 and June 2022 at Tu Du Hospital, Vietnam. The study enrolled all pregnant women suspected of having PAS on US. These patients underwent MRI and CS, using either conservative uterine surgery or hysterectomy based on practical indications. The US/MRI diagnosis was compared to intraoperative diagnosis and/or histopathological confirmation in conservative uterine surgery or cesarean hysterectomy.17
Exclusion criteria included missing patient files, insufficient MRI sign descriptions, and absence of PAS identification via surgery or histology [Figure 1]. This study followed the strengthening the reporting of cohort studies in surgery 2021 guideline for cross-sectional studies.26
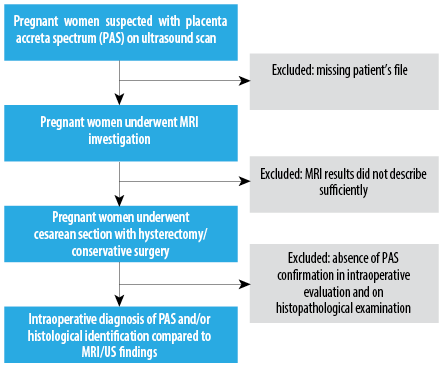 Figure 1: Study flowchart of the present study.
At laparotomy, the diagnosis of PAS was confirmed by experienced surgeons (with over 10 years of practice) following the International Federation of Gynecology and Obstetrics (FIGO) guidelines. PAS was categorized into three grades:27
Grade 1: abnormally adherent placenta (placenta adherenta or accreta). Macroscopically, the uterus shows no obvious distension over the placental bed (placental bulge), and there is no placental tissue invading the uterine surface increased neovascularity.
Grade 2: abnormally invasive placenta (increta). Visible abnormalities over the placental bed include bluish/purple discoloration, distension (placental bulge), significant amounts of hypervascularity (dense tangled bed of vessels or multiple vessels running parallel craniocaudally in the uterine serosa), and placental tissue invading the uterine serosa. Gentle cord traction causes the uterus to be pulled inwards without separation of the placenta (known as the dimple sign).
Grade 3: abnormally invasive placenta (percreta). Abnormal macroscopic findings on the uterine serosal surface (as above) and placental tissue visibly invades the uterine surface, with or without invasion of the bladder or other pelvic tissues/organs.
Histological classification of PAS was based on FIGO consensus, identifying:27
Placenta accreta: placental bed samples showed extended areas of absent decidua between villous tissue and myometrium with placental villi attached directly to the superficial myometrium.
Placenta increta: hysterectomy specimen or partial myometrial resection of the increta area shows placental villi within the muscular fibers and sometimes in the lumen of the deep uterine vasculature (radial or arcuate arteries).
Placenta percreta: villous tissue within or breaching the uterine serosa and invading the bladder wall tissue or urothelium, or invading pelvic tissues/organs (with or without invasion of the bladder).
Sonographic diagnosis was made using transabdominal and transvaginal ultrasonography, where two or more of the following criteria were noted using a standard two-dimensional grayscale/color Doppler ultrasonography: irregular echogenic areas between the uterus and placenta, thinning or interruption of the hyperechogenic interface between the uterine serosa and bladder wall, measured uterine myometrial thickness < 1 cm, turbulent placental lacunae with high-velocity flow (> 15 cm/s), hypervascularity at the uterine serosa-bladder wall interface, and irregular intraplacental vascularization. All patients were scanned using a Samsung HS40 scanner and the US scan was performed by an expert sonographer in the imaging field.28,29
MRI diagnosis followed the inside-out approach and the joint Society of Abdominal Radiology and European Society of Urogenital Radiology guidelines. MRI signs included dark intraplacental bands, heterogeneous placenta, placental bulge, lumpy contour, disorganized vascularity, thinning of the retroplacental T2 dark zone, myometrial thinning, and disruption of the myometrium. Each sign contributed to a scoring system used to assess PAS severity.30–34
Figure 2 shows all MRI features of PAS. Dark intraplacental bands are wedge-shaped areas of low signal intensity on T2-weighted images. Heterogeneous placenta is a marked heterogeneous intensity within the placenta. Placental bulge is a focal bulging of the uterine contour. A lumpy contour/rounded edge is a normal placenta with a smooth contour and tapering angled edges. The lumpy contour and rounded edge that result from placental tethering are imaging features that can be identified in PAS disorders. Abnormal/disorganized placental vascularity/lacunae are tortuous enlarged flow voids observed on T2. Thinning/loss of retroplacental T2 dark zone is a placenta-myometrial interface that is interrupted in PAS cases since it is detected on MRI as a loss of the retroplacental dark line on a T2-weighted image. This finding is usually associated with other signs, such as a focal myometrial defect and myometrial thinning. Myometrial thinning is the thinning of the myometrium over the placenta to < 1 mm or even invisible. Focal disruption of the myometrium is identified at the site of placental invasion.
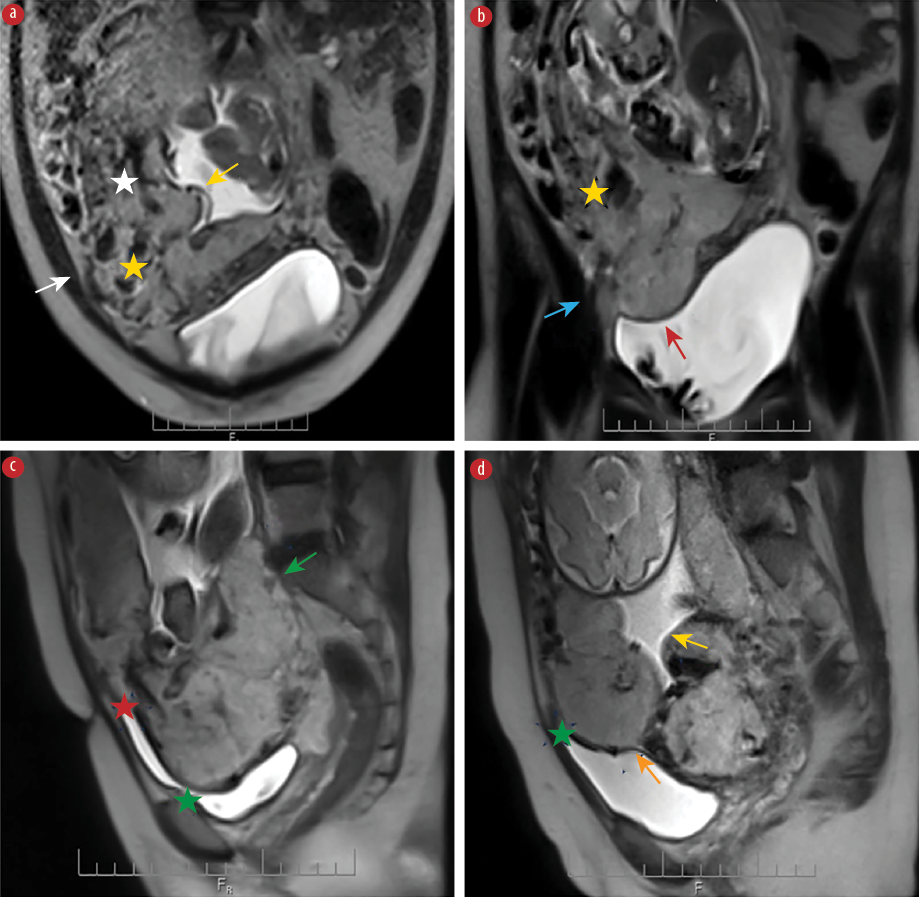 Figure 2: MRI features of PAS showing the (a) abnormal/disorganized placental vascularity (white star), heterogenous signal placenta (yellow star), focal exophytic mass (white arrow), and lumpy contour (yellow arrow) in the axial plane. (b) Heterogenous signal placenta (yellow star), focal interruption in myometrial wall (blue arrow), and loss of demarcation/retroplacental T2 dark zone (red arrow) in the coronal plane.
(c) Sagittal plane reveals rounded edge (green arrow), intraplacental dark band (red star), and uterine bulging (green star). (d) Lumpy contour (yellow arrow), uterine bulging (green star), and thinning myometrial thickness (orange arrow) in the sagittal plane.
The imaging features are only observed when the myometrium is well depicted. The bladder extension criteria includes the bladder wall's interruption, tenting of the bladder dome, marked chaotic vascularity at the interface between the uterus and bladder, and focal placental tissue inside the bladder. Focal exophytic mass is defined as placental tissue protruding through the uterine wall and extending beyond it. Most commonly seen inside at least partially filled urinary bladder and laterally into the parametrium.31,33,34
MRI performance was carried out with a machine labeled Siemens Magnetom Espree 1.5 Tesla (USA). The technique used appropriately a pulse sequence of the T2 HASTE, T2FS, T1W, DW, ADC, and true FISP on the sagittal, coronal, and axial planes.
The results were analyzed by an experienced radiologist. The MRI was performed before the CS about 1–2 weeks.
All data were retrieved from medical records. Continuous variables included maternal age, gestational age at the first diagnosis of PAS, gestational age at cesarean delivery, and EBL. Categorical variables encompass residence, parity, history of CS, number of uterine scar, history of curettage, vaginal bleeding symptom, hematuria, type of PAS on MRI/US, in surgery, and on histopathological examination, the location of placenta on MRI/US, surgical methods, EBL greater/less than 1500 mL, and all MRI features of PAS. The type of PAS consists of placenta adherent to the myometrial layer (accreta, PAS 1), invasive to the myometrial layer (increta, PAS 2), and invasive to the serosal layer (percreta, PAS 3). The surgical methods, including cesarean hysterectomy and conservative surgery (traditional approach and modified one-step conservative surgery), were performed following the intraoperative evaluation, the experience of the surgeon, and the strict protocol of our hospital.5,15,17
The data was entered using EpiData 2.0 software and analyzed using Stata 15 and SPSS (IBM Corp. Released 2019. IBM SPSS Statistics for Windows, Version 26.0. Armonk, NY: IBM Corp). Descriptive statistics were expressed as means and ±SDs, and median and IQR (Q1–Q3 corresponding to the percentile of 25.0–75.0%, using Tukey’s Hinges) for quantitative variables depending on data distribution. Frequency data with percentages and comparison of categorical variables were performed using the chi-square test. If the counting variable has a theoretical number < 5 in each cell (> 25% of the table), the p-value is obtained by Fisher’s exact probability test. Statistical tests were applied for nonparametric tests where appropriate. The odds ratio (OR) was calculated from the 2 × 2 table. A p-value < 0.05 was considered statistically significant.
The Se and Sp of each MRI sign were calculated based on the number of PAS cases that were concordant and discordant with intraoperative diagnosis and/or histopathological confirmation. Youden’s index was calculated as J = Se + Sp - 1.
Results
A total of 87 cases suspected of PAS on US met the inclusion criteria. The intraoperative diagnosis and histopathological confirmation as golden standard criteria identified 83 cases with PAS and four without PAS. The median value of EBL in the PAS group is greater than in the non-PAS group (1000 (600–2000) mL vs. 500 (250–850)mL). An EBL > 1500 mL was recorded in all PAS pregnant women. However, the difference is not statistically significant. All baseline characteristics of the study population and their association with PAS diagnosis are shown in Table 1 and Appendix 1.
Table 1: Baseline characteristics of the study population (N = 87).
|
Maternal age, years, mean ± SD
|
|
36.0 ± 5.7 (28–41)
|
35.3 ± 5.4 (21–47)
|
35.9 ± 5.7 (21–47)
|
|
21–30
|
13 (15.7)
|
1 (25.0)
|
14 (16.1)
|
|
31–40
|
45 (54.2)
|
2 (50.0)
|
47 (54.0)
|
|
41–50
|
25 (30.1)
|
1 (25.0)
|
26 (29.9)
|
|
Parity
|
Nulliparous
|
2 (2.4)
|
0 (0.0)
|
2 (2.3)
|
|
1
|
43 (51.8)
|
4 (100)
|
47 (54.0)
|
|
2
|
31 (37.3)
|
0 (0.0)
|
31 (35.6)
|
|
≥ 3
|
7 (8.4)
|
0 (0.0)
|
7 (8.0)
|
|
History of CS
|
No
|
6 (7.2)
|
0 (0.0)
|
6 (6.9)
|
|
Yes
|
77 (92.8)
|
4 (100)
|
81 (93.1)
|
|
Number of CS
|
1
|
49 (63.6)
|
4 (100)
|
53 (65.4)
|
|
2
|
24 (31.2)
|
0 (0.0)
|
24 (29.6)
|
|
≥ 3
|
4 (5.2)
|
0 (0.0)
|
4 (4.9)
|
|
Other uterine scar
|
No
|
81 (97.6)
|
4 (100.0)
|
85 (97.7)
|
|
Yes
|
2 (2.4)
|
0 (0.0)
|
2 (2.3)
|
|
History of curettage
|
No
|
70 (84.3)
|
4 (100)
|
74 (85.1)
|
|
Yes
|
13 (15.7)
|
0 (0.0)
|
13 (14.9)
|
|
Vaginal bleeding
|
No
|
70 (84.3)
|
3 (75.0)
|
73 (83.9)
|
|
Yes
|
13 (15.7)
|
1 (25.0)
|
14 (16.1)
|
|
Hematuria
|
No
|
83 (100)
|
4 (100)
|
87 (100)
|
|
Yes
|
0 (0.0)
|
0 (0.0)
|
0 (0.0)
|
|
Estimated blood loss, mL
median IQR (Q1–Q3)
min-max
|
|
1000
(600–2000)
(200–4800)
|
500
(250–850)
(200–1000)
|
1000
(550–2000)
(200–4800)
|
|
EBL, mL
|
< 1500
|
48 (57.8)
|
4 (100.0)
|
52 (59.8)
|
|
≥ 1500
|
35 (42.2)
|
0 (0.0)
|
35 (40.2)
|
|
Surgical method
|
Cesarean hysterectomy
|
37 (44.6)
|
0 (0.0)
|
37 (42.5)
|
|
Conservative surgery
|
46 (55.4)
|
4 (100)
|
50 (57.5)
|
|
Placental location on US
|
Anterior site
|
63 (75.9)
|
3 (75.0)
|
66 (75.9)
|
|
Posterior site
|
11 (13.3)
|
1 (25.0)
|
12 (13.8)
|
|
Lateral site
|
9 (10.8)
|
0 (0.0)
|
9 (10.3)
|
|
Placental location on MRI
|
Anterior site
|
52 (62.7)
|
1 (25.0)
|
53 (60.9)
|
|
Posterior site
|
23 (27.7)
|
1 (25.0)
|
24 (27.6)
|
|
Lateral site
|
8 (9.6)
|
2 (50.0)
|
10 (11.5)
|
|
GA at the first diagnosis of PAS, weeks, mean ± SD
|
|
|
24.3 ± 6.8 (12–36)
|
|
|
< 14
|
|
8 (9.6)
|
|
|
14–28
|
|
48 (57.8)
|
|
|
≥ 28
|
|
27 (32.3)
|
|
|
GA at CS, weeks, mean ± SD
|
|
|
31.1 ± 7.1 (12.5–36.4)
|
|
|
< 34
|
|
61 (73.5)
|
|
|
34–36
|
|
16 (19.3)
|
|
|
≥ 36
|
|
6 (7.2)
|
|
|
Intraoperative PAS diagnosis
|
No
|
|
4 (4.6)
|
|
|
Yes
|
|
83 (95.4)
|
|
|
Type of PAS
following intraoperative evaluation
|
Adherent to myometrial layer (accreta or PAS 1)
|
|
8 (9.6)
|
|
|
Invasive to myometrial layer (increta or PAS 2)
|
|
12 (14.5)
|
|
|
Invasive to serosal layer (percreta or PAS 3)
|
|
63 (75.9)
|
|
|
Histopathological examination identifying PASa
|
No
|
|
2 (3.1)
|
|
|
Yes
|
|
62 (96.9)
|
|
|
Type of PAS on histology
|
Accreta
|
|
1 (1.6)
|
|
|
Increta
|
|
25 (40.3)
|
|
PAS: placenta accreta spectrum; CS: cesarean section; EBL: estimated blood loss; MRI: magnetic resonance imaging; GA: gestational age; US: ultrasound.
aHistopathological examination was confirmed depending on surgical methods with/without relevant specimen of myometrium containing invasive tissue of PAS.
The most frequently observed MRI signs were loss of retroplacental T2 dark zone (78 cases) and placenta previa (70 cases). Table 2 reveals the value of PAS diagnosis according to each MRI sign. Overall, the Se ranges from 10.8–94.0% and the Sp is variable between 25.0% and 100.0%. Notably, the Se and Sp of intraplacental dark bands and focal interruptions in the myometrial wall were 77.1%, 100% and 80.7%, 100%, respectively. Appendix 2 shows the association between the placenta previa on MRI/US and the diagnosis of PAS.
Table 2: Values of magnetic resonance imaging signs in diagnosing placenta accreta spectrum (PAS) disorders (N = 87).
|
Placenta previa
|
No
|
13 (15.7)
|
1 (25.0)
|
14 (16.1)
|
84.3
|
25.0
|
|
Yes
|
70 (84.3)
|
3 (75.0)
|
73 (83.9)
|
|
|
|
Loss of demarcation line/retroplacental T2 dark zone
|
No
|
5 (6.0)
|
2 (50.0)
|
7 (8.0)
|
94.0
|
50.0
|
|
Yes
|
78 (94.0)
|
2 (50.0)
|
80 (92.0)
|
|
|
|
Abnormal/disorganized placental vascularity
|
No
|
39 (47.0)
|
4 (100)
|
43 (49.4)
|
53.0
|
100
|
|
Yes
|
44 (53.0)
|
0 (0.0)
|
44 (50.6)
|
|
|
|
Uterine bulging
|
No
|
58 (69.9)
|
4 (100)
|
62 (71.3)
|
30.1
|
100
|
|
Yes
|
25 (30.1)
|
0 (0.0)
|
25 (28.7)
|
|
|
|
Bladder invasion
|
No
|
72 (86.7)
|
4 (100)
|
76 (87.4)
|
13.3
|
100
|
|
Yes
|
11 (13.3)
|
0 (0.0)
|
11 (12.6)
|
|
|
|
Thinning myometrial thickness
|
No
|
38 (45.8)
|
1 (25.0)
|
48 (55.2)
|
54.2
|
25.0
|
|
Yes
|
45 (54.2)
|
3(75.0)
|
39 (44.8)
|
|
|
|
Intraplacental dark bands
|
No
|
19 (22.9)
|
4 (100)
|
23 (26.4)
|
77.1
|
100
|
|
Yes
|
64 (77.1)
|
0 (0.0)
|
64 (73.6)
|
|
|
|
Heterogeneous signal intensity within the placenta
|
No
|
29 (34.9)
|
1 (25.0)
|
30 (34.5)
|
65.1
|
25.0
|
|
Yes
|
54 (65.1)
|
3 (75.0)
|
57 (65.5)
|
|
|
|
Focal interruptions in myometrial wall
|
No
|
16 (19.3)
|
4 (100)
|
20 (23.0)
|
80.7
|
100
|
|
Yes
|
67 (80.7)
|
0 (0.0)
|
67 (77.0)
|
|
|
|
Lumpy contour and rounded edge
|
No
|
46 (55.4)
|
3(75.0)
|
49 (56.3)
|
44.6
|
75.0
|
|
Yes
|
37 (44.6)
|
1 (25.0)
|
38 (43.7)
|
|
|
|
Maximal placental thickness > 50 mm
|
No
|
60 (72.3)
|
3 (75.0)
|
63 (72.4)
|
27.7
|
75.0
|
|
Yes
|
23 (27.7)
|
1 (25.0)
|
24 (27.6)
|
|
|
|
Focal exophytic mass sign
|
No
|
73 (88.0)
|
4 (100)
|
77 (88.5)
|
12.0
|
100
|
|
Yes
|
10 (12.0)
|
0 (0.0)
|
10 (11.5)
|
|
|
|
No
|
74 (89.2)
|
4 (100)
|
78 (89.7)
|
10.8
|
100
|
Se: sensitivity; Sp: specificity.
Using a total of three to six signs, the Se of MRI varied from 53.0–100%, and the Sp increased from 25.0–100%. The study’s findings revealed the highest Youden’s index of 0.759 at five MRI signs (Se = 75.9%, Sp = 100%) [Table 3].
Table 3: Value of score system in evaluating placenta accreta spectrum (PAS) disorders.
|
Three
|
≥ 3
|
83
|
3
|
100
|
25.0
|
0.250
|
|
< 3
|
0
|
1
|
|
|
|
|
Four
|
≥ 4
|
79
|
2
|
95.2
|
50.0
|
0.452
|
|
< 4
|
4
|
2
|
|
|
|
|
Five
|
≥ 5
|
63
|
0
|
75.9
|
100
|
0.759
|
|
< 5
|
20
|
4
|
|
|
|
|
≥ 6
|
44
|
0
|
53.0
|
100
|
0.530
|
Se: sensitivity; Sp: specificity.
The presence of PAS diagnosis on imaging modalities shows a greater EBL. The antenatal diagnosis with and without PAS on MRI and US related to the greater massive hemorrhage in CS (1000 (600–2000) mL vs. 500 (250–850) mL and 1000 (600–2000) mL vs. 300 (300–500) mL, respectively). In addition, the PAS type of percreta through MRI and US findings increases significantly the rate of cesarean hysterectomy versus conservative surgery (56.4% vs. 43.6% and 63.5% vs. 36.5%, respectively). The detailed results are shown in Table 4 and Figure 3.
Table 4: The association between imaging modalities and clinical outcomes in non-placenta accreta spectrum(PAS) and PAS pregnant women.
|
Diagnosis of PAS on US
|
Non-PAS
|
300 (300–500) 300–700
|
0.046a
|
|
PAS
|
1000 (600–2000) 200–4800
|
|
|
Type of PAS on US
|
Adherent to myometrial layer (accreta)
|
1000 (300–1400) 200–2000
|
< 0.001b
|
|
Invasive to myometrial layer (increta)
|
600 (350–1200) 200–2500
|
|
|
Invasive to serosal layer (percreta)
|
1600 (800–2500) 200–4800
|
|
|
Diagnosis of PAS on MRI
|
Non-PAS
|
500 (250–850) 200–1000
|
0.062a
|
|
PAS
|
1000 (600–2000) 200–4800
|
|
|
Type of PAS on MRI
|
Adherent to myometrial layer (accreta)
|
-
|
0.002b
|
|
Invasive to myometrial layer (increta)
|
700 (450–1200) 200–2500
|
|
|
Invasive to serosal layer (percreta)
|
1500 (800–2500) 200–4800
|
|
|
Diagnosis of PAS on US
|
Non-PAS
|
3 (100.0)
|
0 (0.0)
|
0.270c
|
|
PAS
|
49 (58.3)
|
35 (41.7)
|
|
|
Type of PAS on US
|
Adherent to myometrial layer (accreta)
|
7 (77.8)
|
2 (22.2)
|
0.003d
|
|
Invasive to myometrial layer (increta)
|
19 (82.6)
|
4 (17.4)
|
|
|
Invasive to serosal layer (percreta)
|
23 (44.2)
|
29 (55.8)
|
|
|
Diagnosis of PAS on MRI
|
Non-PAS
|
4 (100.0)
|
0 (0.0)
|
0.145c
|
|
PAS
|
48 (57.8)
|
35 (42.2)
|
|
|
Type of PAS on MRI
|
Adherent to myometrial layer (accreta)
|
1 (100.0)
|
0 (0.0)
|
0.002c
|
|
Invasive to myometrial layer (increta)
|
22 (81.5)
|
5 (18.5)
|
|
|
Invasive to serosal layer (percreta)
|
25 (45.5)
|
30 (54.5)
|
|
|
|
|
|
|
|
Diagnosis of PAS on US
|
Non-PAS
|
0 (0.0)
|
3 (100.0)
|
0.258c
|
|
PAS
|
37 (44.0)
|
47 (56.0)
|
|
|
Type of PAS on US
|
Adherent to myometrial layer (accreta)
|
1 (11.1)
|
8 (88.9)
|
< 0.001d
|
|
Invasive to myometrial layer (increta)
|
3 (13.0)
|
20 (87.0)
|
|
|
Invasive to serosal layer (percreta)
|
33 (63.5)
|
19 (36.5)
|
|
|
Diagnosis of PAS on MRI
|
Non-PAS
|
0 (0.0)
|
4 (100)
|
0.133c
|
|
PAS
|
37 (44.6)
|
46 (55.4)
|
|
|
Adherent to myometrial layer (accreta)
|
0 (0.0)
|
1 (100)
|
0.005c
|
|
Invasive to myometrial layer (increta)
|
6 (22.2)
|
21 (77.8)
|
|
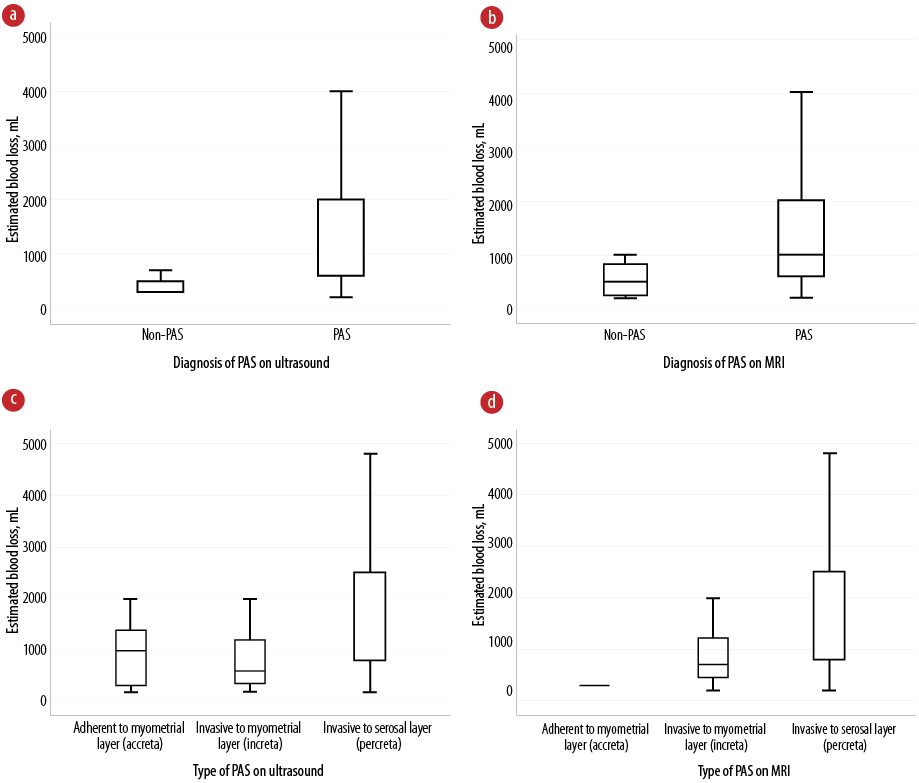 Figure 3: Box plots showing the association between the detection of placenta accreta spectrum (PAS) on imaging modalities and the estimated blood loss, including diagnosis of PAS on (a) US and (b) MRI and type of PAS on (c) US and (d) MRI.
US: ultrasound; MRI: magnetic resonance imaging.
aIndependent samples Mann-Whitney U test (exact sig 2-sided test).
bIndependent samples Kruskal-Wallis test (asymptotic sig 2-sided test).
cFisher’s exact test (exact sig 2-sided).
dPearson chi-square test (exact sig 2-sided).
Discussion
The findings highlighted the varying diagnostic value of specific MRI features for detecting PAS following ultrasound evaluation. The underlying pathology of PAS was demonstrated in the corresponding imaging features.18 The highest Se was observed with the loss of the retroplacental T2 dark zone (94.0%) and focal interruptions in the placenta previa (84.3%). While most signs demonstrated high Sp (75.0–100%), exceptions included placenta previa, heterogeneous signal intensity within the placenta, and thinning myometrial thickness, which had a Sp of only 25.0%.
In the study of Niu et al,35 MRI signs such as myometrial thinning, loss of the T2 hypointense interface, heterogenous intraplacental signals, and intraplacental T2 dark bands were more frequently observed in the PAS group.
Similarly, Mahalingam et al,16 reported that the loss of interface and thinning myometrium showed a Se of 95.24% and a Sp of 87.18%.16 Allameh et al,36 found that uterine bulging and heterogeneous signal intensity had the highest sensitivities (0.89) with specificities of 0.57 and 0.86, respectively. Thiravit et al,14 also reported high Se and Sp for the placental bulge sign, with a Se of 94.4% (34/36 cases) and Sp of 84.6% (22/26 cases). Interobserver agreement analysis showed a kappa value for placental bulge of 0.48 for MRI and 0.40 for US. When combining placental bulge with subjacent dark intraplacental bands, the Se and Sp were 80.6% (29 cases) and 92.3% (24 cases), respectively.14
Romeo et al,37 demonstrated that intraplacental dark bands (p = 0.012) and focal interruption of the myometrial border (p = 0.029) were independently associated with PAS disorders in a cohort of 70 pregnant women using multivariable analysis. The area under the receiver operating characteristic curve (AUC) for PAS prediction increased when combining clinical risk factors (CRFs), US, and MRI signs (0.69, 0.79, and 0.94, respectively; p < 0.05). The accuracy of MRI alone was similar to that obtained by combining CRF, US, and MRI variables (AUC = 0.97) and was significantly higher than combining CRF and US (AUC = 0.83). Hu et al,38 emphasized that intraplacental T2 hypointense bands were crucial for identifying PAS, its invasion depth, and predicting postpartum hemorrhage.
Our findings indicated that using a combination of three to six MRI signs revealed different diagnostic values. The highest Youden’s index was observed with five MRI signs (Se = 75.9%, Sp = 100%). Barzilay et al,30 found that using four or more MRI signs achieved a Se of 0.96% and Sp of 0.6%. Lin et al,39 reported a combined Se of 0.88% (95% CI: 0.79–0.93), Sp of 0.79% (95% CI: 0.68–0.87), and AUC of 0.91 (95% CI: 0.88–0.93) for PAS diagnosis using MRI. Our study identified 11 PAS cases at the posterior site in the PAS group; this location may pose diagnostic challenges for US, leading to inaccurate findings. A systematic review meta-analysis revealed a Se of 0.833% (95% CI: 0.776–0.878) and Sp of 0.834% (95% CI: 0.746–0.897) for US. Regarding MRI, the Se was 0.838 (95% CI: 0.786–0.879) and the Sp was 0.831% (95% CI: 0.770–0.878). There was no statistically significant difference between the two imaging modalities.40
However, according to Romeo et al,37 MRI performance is the best modality to predict PAS in patients with placenta previa independently from clinical risk factors and/or US findings. Thus, clinical evaluation and US assessment should be considered as the first diagnostic level to predict PAS, and MRI should be indicated only for selected cases after stratification in which US findings are uncertain for PAS. Specifically, MRI has the advantages of superior soft tissue resolution and large imaging range and is considered an advanced examination method for the diagnosis of PAS. Moreover, MRI examination is superior to US when the placenta is located at the posterior site, because the placenta is hardly visualized by US.35,41 The imaging pitfalls in the sonographic evaluation of PAS disorders could be minimized when MRI serves as a complementary modality.8
MRI can also help determine the extent and topography of myometrial invasion, particularly in severe PAS cases, aiding in surgical planning.34,42,43 Niu et al,35 demonstrated that MRI is particularly helpful in dilemma cases using US to evaluate the dimension of the placenta and its invasion into the uterine serosa and surrounding organs.
Our study found that the MRI/US diagnosis of PAS was strongly associated with massive EBL and an increased risk of cesarean hysterectomy. The percreta type of PAS on MRI was linked to higher EBL
(≥ 1500 mL) and a greater likelihood of requiring a cesarean hysterectomy. Accordingly, 33 out of 50 PAS pregnant women undergoing cesarean hysterectomy have been recently documented.35 Similarly, half of PAS pregnant women (41/82 cases) were reported with cesarean hysterectomy in the study of Do et al.44 Zhang et al,45 recommended a strict antenatal management for patients at high risk of hemorrhage based on MRI findings, with preparation for blood transfusions to improve pregnancy outcomes. MRI can also help identify patients who may not need a hysterectomy, offering better patient counseling and surgical planning.44
While there is extensive global research on the MRI value in PAS diagnosis, this study specifically focuses on the Vietnamese population. Our hospital provided ample data, and the study described MRI features validated in other populations. MRI diagnoses were compared with histopathological or intraoperative evaluations, ensuring accuracy. However, there was a selection bias toward higher-grade PAS cases, as the hospital primarily handles severe cases. This bias may have influenced the proportion of MRI signs observed, and the observer was not blinded to US findings, limiting the study’s diagnostic accuracy. Future studies should explore MRI and US findings in PAS grade 3, according to FIGO classification, with independent evaluations by separate sonographers and radiologists. Additionally, prospective studies with larger sample sizes are needed to compare MRI and US diagnoses. These studies could also develop a predictive model for severe PAS surgery outcomes based on clinical factors and imaging features.
Conclusion
Each MRI feature offers varying value in diagnosing PAS, with focal interruptions in the myometrial wall being the most significant. Combining MRI with US enhances diagnostic accuracy, especially in suspected PAS cases. Moreover, the presence of PAS on MRI/US correlates with increased intraoperative blood loss and the need for cesarean hysterectomy, making these imaging tools essential for guiding preoperative planning and improving patient outcomes. Further research is needed to strengthen MRI’s role in PAS management and refine its use in clinical practice.
Disclosure
The authors declare no conflicts of interest. No funding was received for this article. Viet Hung Nguyen and Phuc Nhon Nguyen contributed equally to this work and shared the first authorship.
Acknowledgments
We thank the patients, for participating in our research to publish the clinical data. The authors are also grateful for all colleagues working at the Department of Diagnostic Imaging, Department of High-risk Pregnancy, Department of Anesthesiology and Reanimation, and Department of Histopathology, Tu Du Hospital. All of them contributed to taking care of patients and shared their precious experiences related to managing this clinical course with us.
references
- 1. Morlando M, Collins S. Placenta accreta spectrum disorders: challenges, risks, and management strategies. Int J Womens Health 2020 Nov;12:1033-1045.
- 2. Nguyen PN, Vuong AD, Pham XT. Neonatal outcomes in the surgical management of placenta accreta spectrum disorders: a retrospective single-center observational study from 468 Vietnamese pregnancies beyond 28 weeks of gestation. BMC Pregnancy Childbirth 2024 Apr;24(1):228.
- 3. Matsuzaki S, Mandelbaum RS, Sangara RN, McCarthy LE, Vestal NL, Klar M, et al. Trends, characteristics, and outcomes of placenta accreta spectrum: a national study in the United States. Am J Obstet Gynecol 2021;225(5):534.e1-534.e38.
- 4. Pegu B, Thiagaraju C, Nayak D, Subbaiah M. Placenta accreta spectrum-a catastrophic situation in obstetrics. Obstet Gynecol Sci 2021 May;64(3):239-247.
- 5. Bao Vuong AD, Thi Pham XT, Nguyen PN. The modified one-step conservative uterine surgery (MOSCUS) in the management of placenta accreta spectrum disorders: which, where, when, and who. Taiwan J Obstet Gynecol 2023 Jul;62(4):621-622.
- 6. Wu X, Yang H, Yu X, Zeng J, Qiao J, Qi H, et al. The prenatal diagnostic indicators of placenta accreta spectrum disorders. Heliyon 2023 May;9(5):e16241.
- 7. Jauniaux E, Bunce C, Grønbeck L, Langhoff-Roos J. Prevalence and main outcomes of placenta accreta spectrum: a systematic review and meta-analysis. Am J Obstet Gynecol 2019 Sep;221(3):208-218.
- 8. Kennedy A, Griffith A, Einerson B, Woodward PJ. Pitfalls in sonographic evaluation of placenta accreta spectrum. WFUMB Ultrasound Open. 2023;1(2):100016.
- 9. Kayem G, Seco A, Vendittelli F, Crenn Hebert C, Dupont C, Branger B, et al. Risk factors for placenta accreta spectrum disorders in women with any prior cesarean and a placenta previa or low lying: a prospective population-based study. Sci Rep 2024 Mar;14(1):6564.
- 10. Zhao J, Li Q, Liao E, Shi H, Luo X, Zhang L, et al. Incidence, risk factors and maternal outcomes of unsuspected placenta accreta spectrum disorders: a retrospective cohort study. BMC Pregnancy Childbirth 2024 Jan;24(1):76.
- 11. You H, Wang Y, Han R, Gu J, Zeng L, Zhao Y. Risk factors for placenta accreta spectrum without prior cesarean section: a case-control study in China. Int J Gynaecol Obstet 2024 Sep;166(3):1092-1099.
- 12. Vuong AD, Nguyen XT, Nguyen PN. Placenta accreta spectrum on an unscarred uterus in the third-trimester pregnancy: two rare cases at Tu Du Hospital in Vietnam. Int J Surg Case Rep 2022 Oct;99:107603.
- 13. Hakimi HM, Ramli N, Napes MM, Wahab WN, Abdul Rohim RA. Placenta Accreta Spectrum in Normal situated placenta and unscarred uterus. Oman Med J 2024 Mar;39(2):e618.
- 14. Thiravit S, Ma K, Goldman I, Chanprapaph P, Jha P, Hippe DS, et al. Role of ultrasound and MRI in diagnosis of severe placenta accreta spectrum disorder: an intraindividual assessment with emphasis on placental bulge. AJR Am J Roentgenol 2021 Dec;217(6):1377-1388.
- 15. Thi Pham XT, Bao Vuong AD, Vuong LN, Nguyen PN. A novel approach in the management of placenta accreta spectrum disorders: a single-center multidisciplinary surgical experience at Tu Du Hospital in Vietnam. Taiwan J Obstet Gynecol 2023 Jan;62(1):22-30.
- 16. Mahalingam HV, Rangasami R, Premkumar J, Chandrasekar A. Placenta accreta scoring system (PASS)—assessment of a simplified clinico-radiological scoring system for antenatal diagnosis of placenta accreta. Egypt J Radiol Nucl Med 2021;52(1):42.
- 17. Vuong AD, Pham TH, Pham XT, Truong DP, Nguyen XT, Trinh NB, et al. Modified one-step conservative uterine surgery (MOSCUS) versus cesarean hysterectomy in the management of placenta accreta spectrum: a single-center retrospective analysis based on 619 Vietnamese pregnant women. Int J Gynaecol Obstet 2024 May;165(2):723-736.
- 18. Yu FN, Leung KY. Antenatal diagnosis of placenta accreta spectrum (PAS) disorders. Best Pract Res Clin Obstet Gynaecol 2021 Apr;72:13-24.
- 19. Maged AM, El-Mazny A, Kamal N, Mahmoud SI, Fouad M, El-Nassery N, et al. Diagnostic accuracy of ultrasound in the diagnosis of placenta accreta spectrum: systematic review and meta-analysis. BMC Pregnancy Childbirth 2023 May;23(1):354.
- 20. Faralli I, Del Negro V, Chinè A, Aleksa N, Ciminello E, Piccioni MG. Placenta accreta spectrum (PAS) disorder: ultrasound versus magnetic resonance imaging. Diagnostics 2022;12(11):2769.
- 21. Hong S, Le Y, Lio KU, Zhang T, Zhang Y, Zhang N. Performance comparison of ultrasonography and magnetic resonance imaging in their diagnostic accuracy of placenta accreta spectrum disorders: a systematic review and meta-analysis. Insights Imaging 2022 Mar;13(1):50.
- 22. Kolak M, Gerry S, Huras H, Al Naimi A, Fox KA, Braun T, et al; IS-PAS group. External validation of and improvement upon a model for the prediction of placenta accreta spectrum severity using prospectively collected multicenter ultrasound data. Acta Obstet Gynecol Scand 2024 Aug.
- 23. Familiari A, Liberati M, Lim P, Pagani G, Cali G, Buca D, et al. Diagnostic accuracy of magnetic resonance imaging in detecting the severity of abnormal invasive placenta: a systematic review and meta-analysis. Acta Obstet Gynecol Scand 2018 May;97(5):507-520.
- 24. Fiocchi F, Monelli F, Besutti G, Casari F, Petrella E, Pecchi A, et al. MRI of placenta accreta: diagnostic accuracy and impact of interventional radiology on foetal-maternal delivery outcomes in high-risk women. Br J Radiol 2020 Oct;93(1114):20200267.
- 25. Koesmarsono B, Aryananda RA, Ariani G, Mardiyana L. Lifesaving diagnosis of placenta accreta spectrum using MRI: report of five cases. Radiol Case Rep 2022 Mar;17(5):1803-1809.
- 26. Mathew G, Agha R, Albrecht J, Goel P, Mukherjee I, Pai P, et al. STROCSS 2021: strengthening the reporting of cohort, cross-sectional and case-control studies in surgery. Int J Surg 2021;96:106165.
- 27. Jauniaux E, Ayres-de-Campos D, Langhoff-Roos J, Fox KA, Collins S; FIGO Placenta Accreta Diagnosis and Management Expert Consensus Panel. FIGO classification for the clinical diagnosis of placenta accreta spectrum disorders. Int J Gynaecol Obstet 2019 Jul;146(1):20-24.
- 28. Calì G, Giambanco L, Puccio G, Forlani F. Morbidly adherent placenta: evaluation of ultrasound diagnostic criteria and differentiation of placenta accreta from percreta. Ultrasound Obstet Gynecol 2013 Apr;41(4):406-412.
- 29. Cahill AG, Beigi R, Heine RP, Silver RM, Wax JR; Society of Gynecologic Oncology; American College of Obstetricians and Gynecologists and the Society for Maternal–Fetal Medicine. Placenta accreta spectrum. Am J Obstet Gynecol 2018 Dec;219(6):B2-B16.
- 30. Barzilay E, Brandt B, Gilboa Y, Kassif E, Achiron R, Raviv-Zilka L, et al. Comparative analysis of ultrasound and MRI in the diagnosis of placenta accreta spectrum. J Matern Fetal Neonatal Med 2022 Nov;35(21):4056-4059.
- 31. Srisajjakul S, Prapaisilp P, Bangchokdee S. Magnetic resonance imaging of placenta accreta spectrum: a step-by-step approach. Korean J Radiol 2021 Feb;22(2):198-212.
- 32. Kapoor H, Hanaoka M, Dawkins A, Khurana A. Review of MRI imaging for placenta accreta spectrum: pathophysiologic insights, imaging signs, and recent developments. Placenta 2021 Jan;104:31-39.
- 33. Polizio RP, Yamauchi FI, Mendes RF, Peres SV, Kondo MM, Francisco RP. Magnetic resonance imaging and previous cesarean section in placenta accrete spectrum disorder: predictor model. Clinics (Sao Paulo) 2022 Mar;77:100027.
- 34. Jha P, Pōder L, Bourgioti C, Bharwani N, Lewis S, Kamath A, et al. Society of abdominal radiology (SAR) and European society of urogenital radiology (ESUR) joint consensus statement for MR imaging of placenta accreta spectrum disorders. Eur Radiol 2020 May;30(5):2604-2615.
- 35. Niu L, Cui W, Zhu C, Lu X, Wang Y, Wang F. Role of magnetic resonance imaging in the diagnosis of placenta accreta. Curr Med Imaging 2023 Jun;20:1-7.
- 36. Allameh Z, Hajiahmadi S, Adibi A, Ebrahimi Oloun Abadi Z, Mahmoodian Dehkordi S. Diagnostic value of ultrasonography and MR in antenatal diagnosis of placenta accreta spectrum. J Foetal Med 2020;7(4):275-281.
- 37. Romeo V, Verde F, Sarno L, Migliorini S, Petretta M, Mainenti PP, et al. Prediction of placenta accreta spectrum in patients with placenta previa using clinical risk factors, ultrasound and magnetic resonance imaging findings. Radiol Med 2021 Sep;126(9):1216-1225.
- 38. Hu Y, Wang Y, Weng Q, Wu X, Xia S, Wang H, et al. Intraplacental T2-hypointense bands may help predict placental invasion depth and postpartum hemorrhage in placenta accrete spectrum disorders in high-risk gravid patients. Magn Reson Imaging 2022 Dec;94:73-79.
- 39. Lin H, Li L, Lin Y, Wang W. Accuracy of magnetic resonance imaging in diagnosing placenta accreta: a systematic review and meta-analysis. Comput Math Methods Med 2022 Aug;2022:2751559.
- 40. De Oliveira Carniello M, Oliveira Brito LG, Sarian LO, Bennini JR. Diagnosis of placenta accreta spectrum in high-risk women using ultrasonography or magnetic resonance imaging: systematic review and meta-analysis. Ultrasound Obstet Gynecol 2022 Apr;59(4):428-436.
- 41. Hamisa M, Mashaly E, Fathy S, Tawfeek A. Role of doppler US and MRI in diagnosis of placenta accreta. Alex J Med 2015;51(3):225-230.
- 42. Baumann HE, Pawlik LK, Hoesli I, Schoetzau A, Schoenberger H, Butenschoen A, et al. Accuracy of ultrasound for the detection of placenta accreta spectrum in a universal screening population. Int J Gynaecol Obstet 2023 Jun;161(3):920-926.
- 43. Patel-Lippmann KK, Planz VB, Phillips CH, Ohlendorf JM, Zuckerwise LC, Moshiri M. Placenta accreta spectrum disorders: update and pictorial review of the SAR-ESUR joint consensus statement for MRI. Radiographics 2023 May;43(5):e220090.
- 44. Do QN, Herrera CL, Rosenthal EA, Xi Y, Uddin N, Lewis MA, et al. Magnetic resonance imaging improves diagnosis of placenta accreta spectrum requiring hysterectomy compared to ultrasound. Am J Obstet Gynecol MFM 2024 Mar;6(3):101280.
- 45. Zhang S, Li X, Jin Y, Cheng L, Wu T, Hou X, et al. The role of MRI in “estimating” intraoperative bleeding during cesarean section for placenta accreta: a prospective cohort study. Heliyon 2024 Aug;10(17):e36480.