There is a growing recognition that sleep plays a vital role in healthy development and overall physical as well as mental well-being of an individual. American Academy of Sleep Medicine recommends that adults should sleep regularly for seven hours or more.1 Sleep enables recovery from daytime tiredness and promotes repairing and building of muscles and growth of bones.2 Sleep is also important for neural development, cognitive functioning, mental health, and cardiovascular and metabolic function.1 The process of sleep is influenced by several complex factors including the circadian rhythm, and is affected by a variety of biological and environmental factors, activity types and levels, and regularity of bedtime.3,4
The term sleep disorders refers to conditions that disrupt the timing, quality, and duration of sleep, usually resulting in impaired function and daytime distress.3 Inadequate sleep is associated with impaired attention, alertness, and memory.5 It also leads to fatigue, depression, excessive daytime sleepiness, and poor academic performance.6 Chronic sleep deprivation could raise the longer-term risk of obesity, diabetes, hypertension, cardiovascular disease, and all-cause mortality.7,8
College students are especially susceptible to sleep deprivation and disturbances.9 Irregular sleep schedules, excessive use of electronic devices near bedtime, and consumption of energy drinks and alcohol tend to accentuate their poor sleep habits.10
The aim of this study was to screen university students in the UAE to determine the irregularity in their sleep schedule, determine the prevalence of poor sleep quality, daytime sleepiness, and fatigue, and to estimate the correlation between them.
Methods
This cross-sectional survey was conducted among undergraduate students in Ajman University, UAE during the academic year 2022–2023. The study was approved by the Research Ethics Committee, Ajman University (No. M-F-H-12-Sep).
Poor sleep quality prevalence has been estimated in the range of 35–75%. Assuming a prevalence of 50% in our target population, we estimated the minimum sample size to be 384. Invitations were sent electronically to all students at the university; 557 students consented to participate. They were sent the survey link by email followed by a reminder email after two weeks. The participant was required to click the link provided in the email, which opened the online survey in Microsoft Forms format. The survey comprised five sections:
- Sociodemographic information (four items).
- Sleep/bedtime frequency (one item).
- Pittsburgh Sleep Quality Index (PSQI) questionnaire11 collects qualitative and quantitative information regarding the subjects’ previous one month’s sleep quality and assesses their sleep problems and their severity. There are 19 questions grouped into seven components. Each response scores 0, 2, or 3. The combined score of all seven components yields the global PSQI score ranging from 0–21 where 0 means no difficulty and 21 stands for the severest difficulty.
- Epworth Sleepiness Scale (ESS) is an eight-item questionnaire that evaluates daytime sleepiness on a scale of 0–24.12 The higher the score, the more severe the daytime sleepiness. Response to each question is scored on a four-point Likert scale, where 0 = no chance of dozing; 1 = slight chance of dozing; 2 = moderate chance of dozing; and 3 = high chance of dozing. The total scores are categorized as follows: 0–7 = daytime sleepiness unlikely; 8–9 = average daytime sleepiness; 10–15 = excessive sleepiness in some situations; and 16–24 = excessive sleepiness warranting medical attention.
- Fatigue Severity Scale (FSS)13 is a nine-item Likert scale used to assess the severity of one’s experience of fatigue and its impact on certain life activities.
The vast majority (537; 96.4%) of students who consented to participate completed and returned the survey. All data was gathered in Microsoft Excel 2013 and analyzed using SPSS Statistics (IBM Corp. Released 2012. IBM SPSS Statistics for Windows, Version 21.0. Armonk, NY: IBM Corp.). Descriptive statistics were calculated for participant scores for PSQI, ESS, and FSS and their mean, and SD. Chi-square analysis, Mann-Whitney U test, Wilcoxon rank-sum test, and Spearman’s correlation were conducted to probe for associations between irregular bedtime frequency and PSQI, ESS, and FSS scores across different variables. Due to the insufficient number of participants, sixth-year students (except those enrolled in Bachelor of Dental Surgery, Bachelor of Medicine and Bachelor of Surgery, and Bachelor of Science in Engineering) were excluded from the chi-square and analysis of variance that studied the differences in variables across various groups. The data from all academic years and programs were combined for all other analyses.
Results
Participants in this study comprised of 537 students. The majority were female (65.7%; 353). Nearly half (265; 49.3%) of the participants were enrolled in the Bachelor of Dental Surgery program. Table 1 shows the demographic data — except age distribution, which is illustrated in Figure 1.
Table 1: Sociodemographic and academic data of participants (N = 537).
|
Female
|
353 (65.7)
|
|
Male
|
184 (34.3)
|
|
Academic program
|
|
|
Bachelor of Architecture/Interior Design
|
10 (1.9.0)
|
|
Bachelor of Dental Surgery
|
265 (49.3)
|
|
Bachelor of Education
|
4 (0.7)
|
|
Bachelor of Law
|
4 (0.7)
|
|
Bachelor of Mass Communication
|
3 (0.6)
|
|
Bachelor of Medicine and Bachelor of Surgery
|
109 (20.3)
|
|
Bachelor of Pharmacy
|
47 (8.8)
|
|
Bachelor of Science in Engineering
|
62 (11.5)
|
|
Bachelor of Finance/Management/Marketing
|
33 (6.2)
|
|
Year of study
|
|
|
First
|
92 (17.1)
|
|
Second
|
159 (29.6)
|
|
Third
|
60 (11.2)
|
|
Fourth
|
110 (20.5)
|
|
Fifth
|
110 (20.5)
|
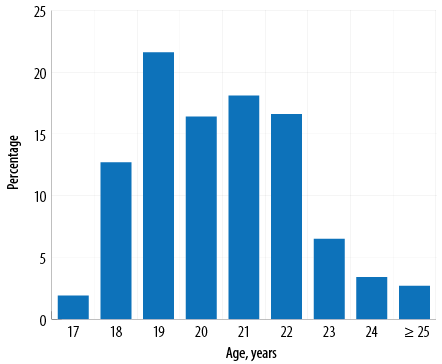 Figure 1: Age distribution of participants as a percentage of the total (N = 537).
The majority (307; 57.2%) of participants failed to observe regular bedtime > 3 nights per week (high-frequency group), while 170 (31.7%) were in the intermediate frequency group, and 60 (11.2%) were in the low-frequency group. Chi-square analysis showed no significant relationship in irregular bedtime frequency with gender [χ2 (2) = 0.574; p = 0.751], year of study [χ2 (8) = 13.092; p = 0.109], or academic program [χ2 (4) = 7.295; p = 0.121].
The vast majority (95.0%) of participants had a global PSQI score of ≥ 5, indicating poor sleep quality [Figure 2]. The overall mean global PSQI score for the cohort was 8.9±3.0.
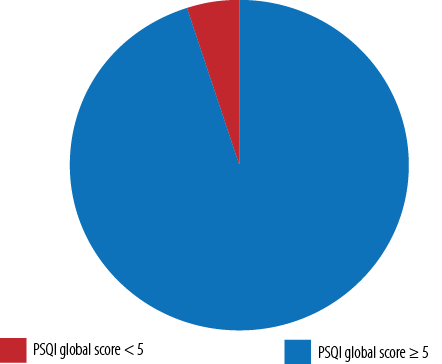 Figure 2: Distribution of the global scores of the Pittsburgh Sleep Quality Index (PSQI) (N = 537).
Most participants (363; 67.6%) reported sleeping < 7 hours daily on average. Of these, 37.7% (137) slept 6–7 hours and 34.7% (126) slept < 5 hours on average. Regarding the ease of falling asleep, 192 (35.8%) participants were able to sleep in < 15 minutes while 189 (35.2%) took 16–30 minutes. The mean and SD for each PSQI component is given in Table 2.
Table 2: Pittsburgh Sleep Quality Index (PSQI) component scores, gender-wise.
|
Subjective sleep quality
|
0.3 ± 0.7
|
0.3 ± 0.7
|
0.3 ± 0.7
|
|
Sleep latency
|
1.5 ± 1.0
|
1.4 ± 1.0
|
1.4 ± 1.0
|
|
Sleep duration
|
1.8 ± 0.8
|
1.9 ± 0.8
|
1.9 ± 0.8
|
|
Habitual sleep efficiency
|
0.8 ± 1.2
|
0.6 ± 1.1
|
0.7 ± 1.1
|
|
Sleep disturbances
|
1.3 ± 0.5
|
1.3 ± 0.6
|
1.3 ± 0.6
|
|
Use of sleep medication
|
1.0 ± 1.0
|
1.3 ± 1.0
|
1.2 ± 1.0
|
|
Daytime dysfunction
|
1.7 ± 0.8
|
1.9 ± 0.7
|
1.8 ± 0.8
|
No significant correlation was found between the average daily sleep time and irregular bedtime frequency (r = 0.001; p = 0.982). However, there was a positive correlation between the irregular bedtime frequency and the global PSQI score (r = 0.311; p < 0.010). Further analysis was conducted to study any variations in the component scores across the different demographics. No significant difference was found in the global or component scores across academic years and academic programs. However, significant gender differences were found in scores of components 5–7, as quantified in Table 3.
Table 3: Mann-Whitney U (U) test results for the scores in components 5–7 of the Pittsburgh Sleep Quality Index (PSQI).
|
Sleep disturbances
|
Male
|
251.2
|
29 200.0
|
0.028*
|
|
Female
|
278.2
|
|
|
|
Use of sleeping medication
|
Male
|
242.4
|
27 583.5
|
0.003*
|
|
Female
|
282.8
|
|
|
|
Daytime dysfunction
|
Male
|
245.3
|
28 127.0
|
0.007*
|
*Significance.
Significant positive correlations were observed between irregular bedtime frequency and five of the seven PSQI components, viz., sleep latency
(r = 2.110; p < 0.010), sleep duration (r = 0.333; p < 0.010), sleep disturbances (r = 0.144; p < 0.010), using sleeping medication (r = 0.205; p < 0.010), and daytime dysfunction (r = 0.338; p < 0.010).
There was a significant negative correlation between irregular bedtime frequency and habitual sleep efficiency (r = -0.141; p < 0.010).
The overall mean score in the nine-item FSS was 40.1±10.7, indicating agreement with being fatigued. However, the majority (380; 70.8%) had a lower mean FSS score (≥ 36). Overall, women were more likely to endorse fatigue (41.0±10.5) than men (38.5±11.0) (U = 278 12.0; p = 0.006). There was no significant correlation between the irregular bedtime frequency and the FSS score of the participants (r = 0.071; p < 0.102), or between academic years or programs.
The scores of the eight-item ESS are illustrated in Figure 3. The mean ESS score for all participants was 10.0±4.5, and 217 (40.4%) endorsed an overall excessive daytime sleepiness (score = 10–15) depending on the situation. Of the students, 12.5% were excessively sleepy and should seek medical attention [Figure 4]. The response distribution, mean, and SD for each item in ESS is given in Table 4.
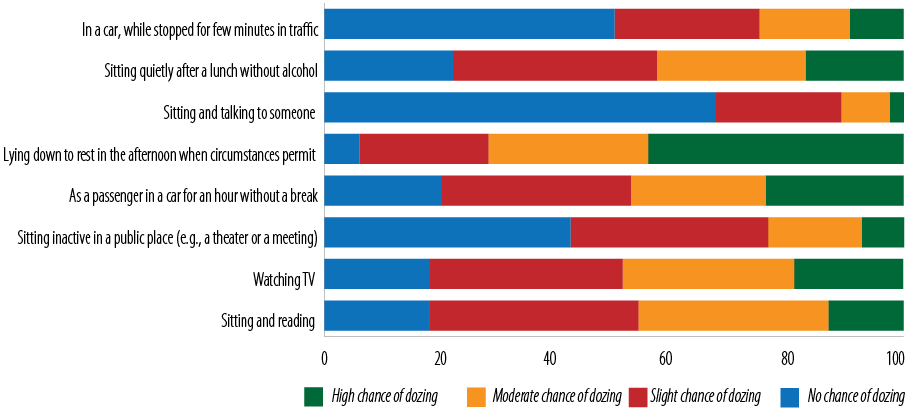 Figure 3: The frequency of the Epworth Sleepiness Scale item-wise responses.
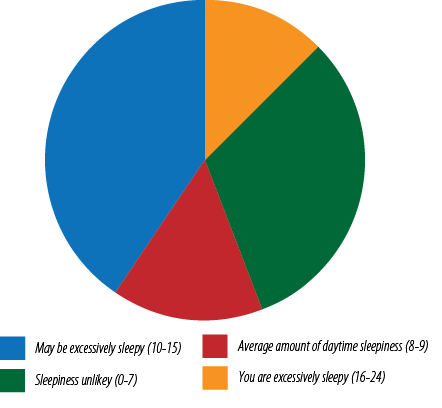 Figure 4: Prevalence of daytime sleepiness among students based on the Epworth Sleepiness Scale.
Table 4: The distribution of the Epworth Sleepiness Scale (ESS) item-wise scores of participants.
|
ESS1: Sitting and reading
|
1.4 ± 0.9
|
|
ESS2: Watching TV
|
1.4 ± 0.9
|
|
ESS3: Sitting inactive in a public place (e.g., a theatre or a meeting)
|
0.8 ± 0.9
|
|
ESS4: As a passenger in a car for an hour without a break
|
1.5 ± 1.0
|
|
ESS5: Lying down to rest in the afternoon when circumstances permit
|
2.1 ± 0.9
|
|
ESS6: Sitting and talking to someone
|
0.4 ± 0.7
|
|
ESS7: Sitting quietly after a lunch without alcohol
|
1.3 ± 1.0
|
There was a significant correlation between the irregular bedtime frequency and the ESS score of the participants (r = 0.113; p = 0.009). There was no significant difference in the ESS score across genders, academic years, or programs.
Discussion
The results of the study indicated a high prevalence of irregular sleep schedules, similar to those of university students in other countries.14,15 Two-thirds of our participants received < 7 hours of sleep, while a recent systematic review of sleep studies from 26 countries found that 40% of university students were sleeping ≤ 6 hours.9
The lack of a significant relationship between gender and the irregularity of sleep schedules among our students is supported by studies on college students in Taiwan and the USA.16,17
Good sleep hygiene that includes a regular sleep schedule is known to help synchronize the circadian rhythm, thereby improving sleep quality.18 We found a significant correlation between our participants’ irregular sleep schedule and their PSQI scores, suggesting a suboptimal sleep hygiene. Taiwanese students with frequent irregular sleep schedules had a reduced total sleep time (possibly they had to be on time for early morning classes).16 However, such a correlation was not found in our study.
Neither the academic year nor the program of study was significantly associated with our students’ sleep patterns or quality of sleep. On the other hand, a cross-sectional survey of 2817 university students in Ethiopia reported that female students or those in their second or third year had higher odds of poor sleep quality.19 A study on 237 Taiwanese university students reported that though freshman students had a shorter sleep duration and senior students had longer sleep latency, there was no significant difference in the total sleep quality across the years.20 The differences in academic programs, sociocultural expectations, peer pressures, and sample sizes might explain such differences. This suggests the need for a focused investigation into the variations in sleep schedules across genders, years, and programs while considering the potential influence of geographical and cultural factors.
The current study found no significant difference between genders in the global PSQI score or ESS. However, the female students had poorer sleep quality and efficiency and were more likely to use sleep medication. Similarly, a Saudi Arabian study found a female predominance among medical students who used sleeping pills.21 The greater intrinsic desire to sleep observed among females might be attributable to biological factors affecting their circadian patterns.22 However, an American study on a cohort of chemistry students found better sleep quality among females than males.23
Despite the FSS demonstrated qualities of strong content, construct, and criterion validity,24 we did not detect any significant relationship between our students’ irregular bedtime frequency and fatiguability. One reason could be that FSS was originally developed to measure fatigue in patients with chronic diseases and may not be sensitive enough for use in healthy young adults.13,25 Indeed, a Swiss study failed to find any significant correlation between FSS and normal participants unlike in people with chronic diseases associated with fatigue.26 However in our study, females had a significantly higher FSS score than males. Poor sleep is positively correlated with higher scores on fatigue assessments,27 which may explain this finding.
The ESS scores revealed that 52.9% of our cohort had excessive daytime sleepiness, higher than the reported prevalence in India (30.5%), Malaysia (35.5%), and Saudi Arabia (36.6%).28–30 A higher prevalence than ours was reported from Brazil (54.4%) and Columbia (60.2%).31,32
The mean ESS score of 10.0±4.5 in our cohort was quite similar to the 10.0±3.7 score among medical students in Brazil.33 The significant correlation between the irregular bedtime frequency and the ESS scores in both studies suggests that irregular sleep schedules decreasing the quality of sleep and aggravating daytime sleepiness. The poorer sleep quality can be attributed to the higher levels of stress and greater financial, and academic pressure of higher education.
This study has some limitations. The participating students did not equally represent the entire student population of this university. Though we had sent invitations to all students of the university, nearly half of those who responded and completed the survey were dental students. The data was collected through an online survey with the potential for recall bias and desirability bias, which might have influenced the results. The scales used relied a lot on qualitative questions that might have been interpreted variously by respondents. Additional data on mobile phone usage and the housing situations of the students would have added value to the study. We used convenience sampling which could have introduced non-response and response bias. Being a cross-sectional study, a causal relationship for results could not be established.
Conclusion
Among university students in the UAE, irregular sleep schedules are widespread, regardless of age, gender, or academic program. Women are more affected than men, experiencing lower sleep quality, more frequent daytime sleepiness, and increased fatigue. It is crucial to encourage all students, especially women, to establish better sleep hygiene. The findings of this research are expected to help generate academic policies that help students improve their sleep quality and provide insights for further research on sleep in the UAE and the Arabian Gulf region in general.
Disclosure
The authors declaread no conflicts of interest. No funding was received for this study.
references
- 1. Watson NF, Badr MS, Belenky G, Bliwise DL, Buxton OM, Buysse D, et al; Consensus Conference Panel. Joint consensus statement of the American academy of sleep medicine and sleep research society on the recommended amount of sleep for a healthy adult: methodology and discussion. J Clin Sleep Med 2015 Aug;11(8):931-952.
- 2. Stich FM, Huwiler S, D’Hulst G, Lustenberger C. The potential role of sleep in promoting a healthy body composition: underlying mechanisms determining muscle, fat, and bone mass and their association with sleep. Neuroendocrinology 2022;112(7):673-701.
- 3. Jefferson CD, Drake CL, Scofield HM, Myers E, McClure T, Roehrs T, et al. Sleep hygiene practices in a population-based sample of insomniacs. Sleep 2005 May;28(5):611-615.
- 4. Misulis K, Head T. Netter’s concise neurology updated edition. 1st ed. Philadeplia, PA: Elsevier; 2016.
- 5. García A, Angel JD, Borrani J, Ramirez C, Valdez P. Sleep deprivation effects on basic cognitive processes: which components of attention, working memory, and executive functions are more susceptible to the lack of sleep? Sleep Sci 2021;14(2):107-118.
- 6. Tsou MT, Chang BC. Association of depression and excessive daytime sleepiness among sleep-deprived college freshmen in Northern Taiwan. Int J Environ Res Public Health 2019 Aug;16(17):3148.
- 7. Ramos AR, Wheaton AG, Johnson DA. Sleep deprivation, sleep disorders, and chronic disease. Prev Chronic Dis 2023;20:E77.
- 8. Shen X, Wu Y, Zhang D. Nighttime sleep duration, 24-hour sleep duration and risk of all-cause mortality among adults: a meta-analysis of prospective cohort studies. Sci Rep 2016 Feb;6:21480.
- 9. Wang F, Boros S. The effect of physical activity on sleep quality: a systematic review. Eur J Physiother 2021;23(1):11-18.
- 10. Lund HG, Reider BD, Whiting AB, Prichard JR. Sleep patterns and predictors of disturbed sleep in a large population of college students. J Adolesc Health 2010 Feb;46(2):124-132.
- 11. Buysse DJ, Reynolds CF III, Monk TH, Berman SR, Kupfer DJ. The Pittsburgh sleep quality index: a new instrument for psychiatric practice and research. Psychiatry Res 1989 May;28(2):193-213.
- 12. Johns MW. A new method for measuring daytime sleepiness: the Epworth sleepiness scale. Sleep 1991 Dec;14(6):540-545.
- 13. Krupp LB, LaRocca NG, Muir-Nash J, Steinberg AD. The fatigue severity scale. Application to patients with multiple sclerosis and systemic lupus erythematosus. Arch Neurol 1989 Oct;46(10):1121-1123.
- 14. Al Omari O, Khalaf A, Al Sabei S, Ballad CA, Ghani RM, Al-Hashmi I, et al. Insomnia thresholds and associated factors among Omani university students. International Journal of Africa Nursing Sciences 2022 Jan 1;17:100500.
- 15. Li L, Wang YY, Wang SB, Li L, Lu L, Ng CH, et al. Sleep duration and sleep patterns in Chinese university students: a comprehensive meta-analysis. J Clin Sleep Med 2017 Oct;13(10):1153-1162.
- 16. Kang J-H, Chen S-C. Effects of an irregular bedtime schedule on sleep quality, daytime sleepiness, and fatigue among university students in Taiwan. BMC Public Health 2009 Jul;9:248.
- 17. Fischer D, McHill AW, Sano A, Picard RW, Barger LK, Czeisler CA, et al. Irregular sleep and event schedules are associated with poorer self-reported well-being in US college students. Sleep 2020 Jun;43(6):zsz300.
- 18. Foster RG. Sleep, circadian rhythms and health. Interface Focus 2020 Jun;10(3):20190098.
- 19. Lemma S, Gelaye B, Berhane Y, Worku A, Williams MA. Sleep quality and its psychological correlates among university students in Ethiopia: a cross-sectional study. BMC Psychiatry 2012 Dec;12:237.
- 20. Tsai LL, Li SP. Sleep patterns in college students: gender and grade differences. J Psychosom Res 2004 Feb;56(2):231-237.
- 21. Alasmari MM, Alkanani RS, Alshareef AS, Alsulmi SS, Althegfi RI, Bokhari TA, et al. Medical students’ attitudes toward sleeping pill usage: a cross-sectional study. Front Psychiatry 2022 Dec;13:1007141.
- 22. Putilov AA, Sveshnikov DS, Bakaeva ZB, Yakunina EB, Starshinov YP, Torshin VI, et al. Differences between male and female university students in sleepiness, weekday sleep loss, and weekend sleep duration. J Adolesc 2021 Apr;88(1):84-96.
- 23. Okano K, Kaczmarzyk JR, Dave N, Gabrieli JD, Grossman JC. Sleep quality, duration, and consistency are associated with better academic performance in college students. NPJ Sci Learn 2019 Oct;4(1):16.
- 24. Machado MO, Kang NC, Tai F, Sambhi RD, Berk M, Carvalho AF, et al. Measuring fatigue: a meta-review. Int J Dermatol 2021 Sep;60(9):1053-1069.
- 25. Hewlett S, Dures E, Almeida C. Measures of fatigue: Bristol rheumatoid arthritis fatigue multi-dimensional questionnaire (BRAF MDQ), Bristol rheumatoid arthritis fatigue numerical rating scales (BRAF NRS) for severity, effect, and coping, Chalder fatigue questionnaire (CFQ), checklist individual strength (CIS20R and CIS8R), fatigue severity scale (FSS), functional assessment chronic illness therapy (fatigue) (FACIT-F), multi-dimensional assessment of fatigue (MAF), multi-dimensional fatigue inventory (MFI), pediatric quality of life (PedsQL) multi-dimensional fatigue scale, profile of fatigue (ProF), short form 36 vitality subscale (SF-36 VT), and visual analog scales (VAS). Arthritis Care Res (Hoboken) 2011 Nov;63(11)(Suppl 11):S263-S286.
- 26. Valko PO, Bassetti CL, Bloch KE, Held U, Baumann CR. Validation of the fatigue severity scale in a Swiss cohort. Sleep 2008 Nov;31(11):1601-1607.
- 27. Kayser KC, Puig VA, Estepp JR. Predicting and mitigating fatigue effects due to sleep deprivation: a review. Front Neurosci 2022 Aug;16:930280.
- 28. Abdulghani HM, Alrowais NA, Bin-Saad NS, Al-Subaie NM, Haji AM, Alhaqwi AI. Sleep disorder among medical students: relationship to their academic performance. Med Teach 2012;34(1)(Suppl 1):S37-S41.
- 29. Zailinawati AH, Teng CL, Chung YC, Teow TL, Lee PN, Jagmohni KS. Daytime sleepiness and sleep quality among Malaysian medical students. Med J Malaysia 2009 Jun;64(2):108-110.
- 30. Ramamoorthy S, Kamaldeen D, Ravichandran L, Sundaramahalingam M. Effect of stress on sleep hygiene among school going adolescents in Chennai. J Family Med Prim Care 2019 Sep;8(9):2917-2920.
- 31. Dutra da Silva RC, Garcez A, Pattussi MP, Olinto MT. Prevalence and factors associated with excessive and severe daytime sleepiness among healthcare university students in the Brazilian Midwest. J Sleep Res 2022 Jun;31(3):e13524.
- 32. Escobar-Córdoba F, Benavides-Gélvez RE, Montenegro-Duarte HG, Eslava-Schmalbach JH. Excessive daytime drowsiness in ninth-semester medical students attending the Universidad Nacional de Colombia. Revista de la Facultad de Medicina 2011 Sep;59(3):191-200.
- 33. Alóe F, Pedroso A, Tavares SM. Epworth sleepiness scale outcome in 616 Brazilian medical students. Arq Neuropsiquiatr 1997 Jun;55(2):220-226.