Hearing impairment is inarguably an important public health concern. Approximately, 250 million people around the world suffer from this disability making it the most common sensory impairment in humans.1 In Oman, as ear, nose ,and throat services have expanded,2 the reported prevalence of bilateral hearing loss is 5.5%.3 Its early detection and subsequent management makes a significant reduction in the burden on health care services especially regarding language development in children and cognitive decline in the elderly.4,5
The conventional pure tone audiogram is considered the gold standard test to determine hearing handicap.6 However, it has financial and logistic obstacles that mean it is not available in every health center. These barriers may cause a delay in the diagnosis and treatment especially in developing countries.6 The global shortage of hearing health professionals has been a strong motivation for exploring automated audiometers to expand the reach of health care in underserved areas.7 However, the access to these devices is still limited by cost and time.
Unitron, a Canadian based hearing aids company, has developed an application called uHear. The application is a self-administered screening tool for use in areas where resources are limited to reduce the number of individuals with unidentified hearing impairment.7 It functions on IOS devices (e.g., iPad and iPhone) and can be downloaded for free in the App Store.8 The program uses the principles of automated audiology making it user-friendly. If proven to be accurate and comparable to the gold standard pure tone audiometry, it could become a revolutionary screening tool for detecting hearing impairment as these devices are very popular among people from all spectra and much cheaper compared to the conventional audiogram. By validating the app as a screening tool, healthcare workers in primary care could detect hearing loss and reduce unnecessary referrals. Due to lack of adequate research to determine the accuracy of uHear its use as a screening tool is limited. We conducted a preliminary study to evaluate the efficacy of uHear compared to the gold standard tool.
Methods
Seventy students (140 ears) from Sultan Qaboos University were enrolled from Student’s Service Centre and the campus of the College of Medicine and Health Sciences. All participants were above 17 years old. There were 36 males and 34 females. All participants had normal hearing threshold as per the gold standard test. Those who had a hearing impairment or suspicion of hearing loss were excluded.
The study was approved by the Sultan Qaboos University Medical Research and Ethics Committee. All participants gave their written informed consent.
Patients had an otoscopic examination to ensure patent external canal and intact tympanic membrane. A hearing test was done by conventional pure tone audiometry in a soundproof booth by two audiologists from the Department of Clinical Physiology. Sound stimuli were presented using headphones to each ear separately using the Hughson-Westlake method in frequencies ranging from 250 Hz to 8000 Hz. The uHear screening was then self-performed by the participant using an iPad in a side room resembling the clinical setting and again in a soundproof booth. Audiologists were blinded to the results of the uHear application, and the tests were conducted in a random order.
The uHear uses a 267 ms pulse duration and employs a simple “10 dB down and 5 dB up” approach. The lowest threshold with two positive responses of three excursions is recorded as the hearing sensitivity. The test results were displayed in a typical audiogram format, indicating pure tone air conduction hearing sensitivities. The pure tone average (PTA) was calculated as the mean of hearing thresholds at 500, 1000, 2000, and 4000 Hz.
SPSS Statistics (SPSS Inc., Chicago, US) and Microsoft Excel (Microsoft, Washington, US) were used for the data analysis. Paired t-test was calculated to compare the mean difference between conventional audiometry and uHear in the side room and the soundproof booth. For reliability to be accepted, the difference in the results from audiometers should not be greater than 10 dB. Any value higher than this was considered statistically significant.
Results
The mean PTA from conventional audiometry was 8 dB for the right ear and 9 dB for the left ear. The PTA with conventional audiometry ranged from 1 to 21 dB across all ears [Figure 1]. For uHear in the side room, for the same participants, it was 25 and 28 dB in the right and left ears, respectively. In this group, the PTA ranged from 3 to 54 dB across all ears. The readings were elevated in comparison to conventional audiometry. For those who underwent hearing test with uHear in the soundproof room, the mean PTA was 18 dB in the right ear and 17 dB in the left ear with the PTA ranging from 1 to 43 dB.
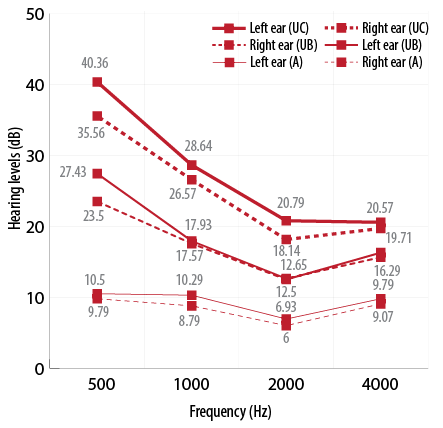
Figure 1: Mean pure tone average measured by audiometry (A), uHear in the booth (UB) and uHear in the clinic (UC).
The mean difference between the conventional and uHear PTA in the soundproof booth varied from 5.6 dB to 17.6 dB with the standard deviation (SD) ranging from 7 dB to 15 dB [Table 1]. The difference was statistically different only at one frequency (500 Hz). The mean difference between conventional and side room uHear varied from 6 dB to 18 dB and the SD ranged from 7 dB to 15 dB [Table 2]. These values were statistically significant at all frequencies.
Table 1: Mean difference and standard deviation values between thresholds obtained from audiometry and uHear in the soundproof booth.
|
Right ear |
18±15 |
9±11 |
7±8 |
7±9 |
Table 2: Mean difference and standard deviation values between thresholds obtained from audiometry and uHear in the side room (clinical setting).
|
Right ear |
26±15 |
18±14 |
12±8 |
11±9 |
Discussion
Although hearing screening provides a solution to the increased number of hearing tests needed around the world, there is still a huge gap between the number of individuals in need of audiological services in a given population and the number of providers available to conduct relevant services for that population.7 Telehealth audiology and automated audiology are two alternatives. Telehealth involves delivery of health care using telecommunications technology such as dial-up, computer networks, and the internet.9,10 Automated audiology involves the use of automating audiological procedures involved in a basic hearing test battery.11 However, access to these devices is still limited by cost and time. The conventional audiogram remains the gold standard for measuring hearing sensitivity but has geographic, financial, and logistical obstacles that could potentially lead to delays in the diagnosis.12-14 Current evidence suggests that automated audiometry is valid and reliable for diagnostic audiometry.15
In our study, the mean difference between the conventional audiometer and uHear in the side room was greater than 10 dB at all frequencies. This raises the doubt about its accuracy in the side room (which resembles a clinical setting) and hence in peripheral health centers. However, the mean difference between uHear in the soundproof booth and the audiometer was only statistically significant at 500 Hz. This means if the PTA is calculated for the same participants in the soundproof booth, it is slightly elevated compared to conventional audiometry because the PTA is the mean of 500, 1000, 2000 and 4000 Hz. The mean PTA in both right and left ear in the conventional, as well as the uHear test in the soundproof booth, was within normal range. This indicates that the thresholds of uHear in the soundproof room are closer to the conventional test. If the participants who scored a PTA more than 25 dB (those who have mild hearing impairment) needed a referral to a specialized center for further evaluation by a conventional audiometer, only 23% of participants would have been referred if they were tested by uHear in a soundproof booth. However, 64% of participants would have been referred if they were tested by uHear in a side room. On the other hand, if we consider referring only those with a PTA score more than 40 dB (moderate hearing impairment), then only 3% would have been referred from those tested in a soundproof room and 13% from those in the clinical setting.
Our observations indicate that uHear is a potential tool if it is used to exclude the presence of moderate hearing impairment. As moderate hearing loss clearly warrants further evaluation, this interpretation is an important outcome of our study.
The 16 bit digital to analog converter in the iPod or iPhone limits the dynamic range of the uHear application to approximately 85 dB (15–100 dB). Hence, it lacks specificity in the range of normal hearing thresholds, which fall within its lower limit of the dynamic range.6 Also in our study, the uHear hearing thresholds were high at lower frequencies (500 and 1000 Hz) when compared to conventional audiometry even though the response was comparable to the soundproof room [Figure 1]. This clearly signifies the inefficiency of uHear as a screening test to confirm normal hearing.
The worsening of the test results obtained when conducting the test in a clinical setting compared to the soundproof booth undoubtedly points to the effect of ambient noise levels. The use of non-calibrated insert earphones also might have contributed to sound leakage and worsening of results. As the performance of the uHear test is entirely dependent on the individual undergoing the test unlike the conventional audiometer, the consistency of the individuals’ performance also cannot be ascertained.
Conclusion
Our study had two conclusions. First, the use of the uHear app in a clinical setting is highly inaccurate in giving the exact hearing thresholds and is more reliable when conducted in a soundproof booth. Secondly, there is potential for the use of uHear to exclude moderate hearing impairment (more than 40 dB) even in clinical settings. However, further case-control studies are required in larger groups to establish its use in screening hearing deficits in the community.
Disclosure
The authors declared no conflicts of interest. No funding was received for this study.
Acknowledgements
The authors would like to thank voluntary participants who enrolled in this study.
references
- 1. Mathew C, Smith A, Concha M. Global burden of hearing loss in the year 2000. Geneva: World Health Organization; 2000.
- 2. Al-Khabori M. Evolution of ENT services in Oman. Oman Med J 2008 Apr;23(2):65.
- 3. Al Khabori M, Khandekar R. The prevalence and causes of hearing impairment in Oman: a community-based cross-sectional study. Int J Audiol 2004 Sep;43(8):486-492.
- 4. Yoshinaga-Itano C, Sedey AL, Coulter DK, Mehl AL. Language of early- and later-identified children with hearing loss. Pediatrics 1998 Nov;102(5):1161-1171.
- 5. Swanepoel W, Clark JL, Koekemoer D, Hall JW III, Krumm M, Ferrari DV, et al. Telehealth in audiology: the need and potential to reach underserved communities. Int J Audiol 2010 Mar;49(3):195-202.
- 6. Szudek J, Ostevik A, Dziegielewski P, Robinson-Anagor J, Gomaa N, Hodgetts B, et al. Can Uhear me now? Validation of an iPod-based hearing loss screening test. J Otolaryngol Head Neck Surg 2012 Apr;41(Suppl 1):S78-S84.
- 7. Khoza-Shangase K, Kassner L. Automated screening audiometry in the digital age: exploring uhear™ and its use in a resource-stricken developing country. Int J Technol Assess Health Care 2013 Jan;29(1):42-47.
- 8. Audiology online, Unitron turns up the volume on UHear availability 2010. [cited 2015 March 15]. Available from: http://www.audiologyonline.com/releases/unitron-turns-up-volume-on-3186.
- 9. Wootton R. Recent advances: Telemedicine. BMJ 2001 Sep;323(7312):557-560.
- 10. Lancaster P, Krumm M, Ribera J, Klich R. Remote hearing screenings via telehealth in a rural elementary school. Am J Audiol 2008 Dec;17(2):114-122.
- 11. Margolis RH, Morgan DE. Automated pure-tone audiometry: an analysis of capacity, need, and benefit. Am J Audiol 2008 Dec;17(2):109-113.
- 12. Gates GA, Murphy M, Rees TS, Fraher A. Screening for handicapping hearing loss in the elderly. J Fam Pract 2003 Jan;52(1):56-62.
- 13. Ho AT, Hildreth AJ, Lindsey L. Computer-assisted audiometry versus manual audiometry. Otol Neurotol 2009 Oct;30(7):876-883.
- 14. Donahue A, Dubno JR, Beck L. Guest editorial: accessible and affordable hearing health care for adults with mild to moderate hearing loss. Ear Hear 2010 Feb;31(1):2-6.
- 15. Swanepoel D, Störbeck C, Friedland P. Early hearing detection and intervention in South Africa. Int J Pediatr Otorhinolaryngol 2009 Jun;73(6):783-786.