Count data are generated by processes yielding non-negative integers exclusively. In simpler terms, this data type encompasses only non-negative and integer values (e.g., 0,1,2,…). Counts denote the frequency of event occurrences within fixed time intervals, exemplified by weekly cholera counts reported per locality, emergencies in referral or secondary care hospitals, and antenatal care (ANC) visits.
While the Poisson model is conventionally used for count data analysis, it is considered constrained by the requirement for mean and variance equality. In medical research, count outcomes with equal mean and variance are rare. The negative binomial model, an alternative to the Poisson, accommodates over-dispersion (variance exceeding the mean). When over-dispersion involves zeros, models like the generalized Poisson (GP), hurdle, and zero-inflated models are recommended.1,2 Over-dispersion attributed to zeros is tackled using mixture models and two-part models such as hurdle and zero-inflated models.3,4 The GP model can substitute a mixture model and two part-part models for over-dispersed count responses due to zeros. The GP model based on maximum likelihood estimation, is versatile for both over-dispersed and under-dispersed data.5,6
Ordinal variables in medical research often express patient characteristics, attitudes, behavior, or status. These variables have natural ordering among their levels like cancer stages (I, II, III, IV), pain levels (0–10 Likert scale), satisfaction levels (very dissatisfied, dissatisfied, neutral, satisfied, very satisfied), and Likert scales measurements in questionnaire surveys (strongly disagree, disagree, agree, strongly agree) among others. A major assumption for ordinal data is the constant effect of an independent variable on the response variable with a unit increase in the independent variable’s level. Essentially, the values are presumed equally distanced and ordered.
Ordinal outcomes are analyzed using ordinal logistic regression (OLR) when specific conditions are met.7,8 When the interest lies in ordinal outcomes that adhere to the proportionality assumption, and the independent variables are categorical, ordinal, or continuous, analysis options include Poisson, zero-inflated Poisson (ZIP), hurdle Poisson, negative binomial models, and proportional odds (PO) models.9 However, studies reveal that medical research often fails to present or analyze statistical data, especially ordinal data, according to the structure of the data.10–12
Many types of ordinal models have been developed, with the most common being the PO and the continuation ratio models. In this paper, we focus solely on the PO model.13 Both models employ maximum likelihood techniques to estimate odds ratios (ORs) but differ in their dichotomizations, referred to as ῾cut-points’. While both models assume homogeneity across cut-points and calculate a single OR, the PO model extends binary logistic regression for binary outcomes to handle ordinal outcomes.13,14 It is also named as cumulative logit model, built on the assumption of identical log ORs across cut-points. At each cut-point, for example, the level of severity is categorized as case and non-case. The OR of an exposure variable (level of severity) for any of these comparisons will be equal irrespective of cut-point is made. In other words, OR is invariant to the dichotomization of the outcome. The PO model assumes that in the hypothetical population from which this sample was drawn, the ORs from each of the two possible dichotomies are the same.
In cases of ordinal responses where the absence of symptoms or disease activity leads to a substantial proportion of zeros, resulting in skewed outcomes, traditional statistical techniques can yield biased findings. In such scenarios, count models prove to be more appropriate.
The GP model serves as a replacement for the mixture model and two part-part models for over-dispersed count responses involving zeros. The GP model, based on maximum likelihood estimation, is suitable for both over-dispersed and under-dispersed data.5,6 In a study by Yusuf and Ugalahi,6 Poisson, negative binomial, and GP were compared to find the best fit for over-dispersed ANC visit counts that involve zeros. Among the three models, GP exhibited the lowest fit statistics values, including log-likelihood, Akaike Information Criteria (AIC), and Bayesian Schwartz Information Criteria (BIC), indicating its suitability for identifying parameters related to ANC visits.
Yadav et al,15 compared GP, mixture Poisson, mixture negative binomial, and ZIP models in terms of fit statistics such as bias, mean square error (MSE), AIC, and BIC, using both real-time and simulated data. This study showed that GP provides lower values of all fit statistics and identifies as a better model. Hence, the goal of this study was to ascertain whether the GP model was a better alternative to the OLR model in zero-inflated outcomes, using both simulated and real-time data.
Methods
The Poisson model has been widely employed for count data analysis. The probability mass function of the Poisson model is given by: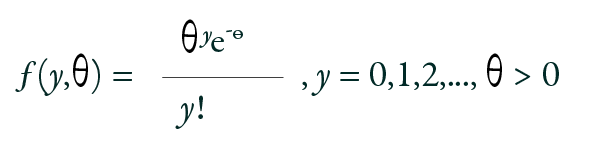
The Poisson model is characterized by a single parameter distribution. Its mean and variance are equal. In the Poisson regression model, the focus is on modeling the conditional mean E (θ|x). The expected outcome in terms of the log function is expressed as θ = exp (xβ), where θ is mean, x is independent variables, and β stands for the regression parameters.16
For over-dispersed or under-dispersed count data, the GP regression model may prove beneficial. It assumes that the outcome variable Yi follows a probability mass function: 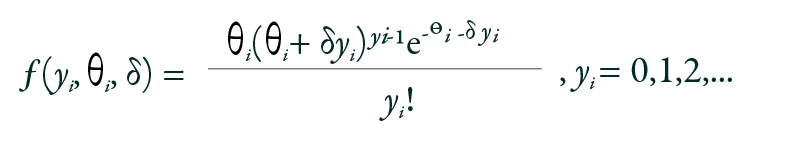
Where θi > 0 and max (−1,− θi /4) < δ < 1. The mean and variance of the GP model are defined as:
|
Mean(ųi) = E(yi) =
|
θi
|
|
(1-δ)
|
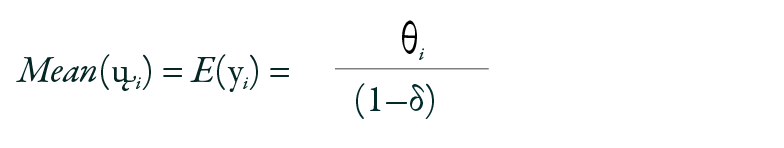
Where φ = 1/(1 − δ)2 is a dispersion factor. When δ = 0, the model becomes equidispersed, reducing to the Poisson model with parameter θi. For δ > 0, over-dispersion is present, and for δ < 0, under-dispersion is observed.17
In practice, the often-used OLR model is the PO model, also referred to as the cumulative logit model. The PO model is invariant to collapsing categories, a technique often used to summarize results.18 For instance, for an outcome variable with four categories, assuming three ways to divide these categories into two collapsed categories while maintaining the natural order, merging groups 0 and 3 for comparison with groups 1 and 2 is not valid, as it disrupts the inherent order. If an ordinal response variable D has G levels (D = 0, 1, 2. . ., G-1), there are G -1 ways to dichotomize the response outcome (e.g., D ≥ 1 vs. D < 1; D ≥ 2 vs. D < 2, ..., D ≥ G-1 vs. D < G-1). The odds that D ≥ g are defined as: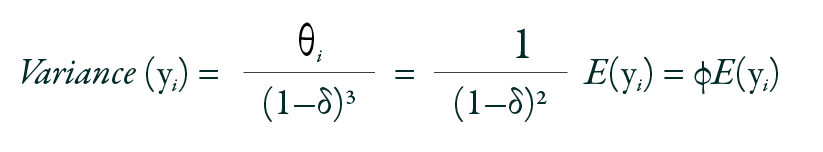
Here, g = 1, 2, 3. . . G-1. An essential assumption of this model is that the OR remains constant when calculated across different cut points. For example, OR (D ≥ 1) = OR (D ≥ 3).19
For model evaluation, AIC and BIC are used [Box 1]. Both models are based on the maximum likelihood estimates, with lower values indicating better model fit. The AIC is defined as:
Box 1: Model preference in terms of AIC and BIC.
|
> 0.1–≤ 2.5
|
No difference in model
|
|
> 2.5–≤ 6.0
|
Choose model A if n > 256
|
|
> 6.0–≤ 9.0
|
Choose model A if n > 64
|
|
> 9
|
Choose model A
|
|
0–2
|
Weak
|
|
2–6
|
Positive
|
|
6–10
|
Strong
|
AIC: Akaike Information Criteria; BIC: Bayesian Schwartz Information Criteria.
AIC = -2L + 2k
Where L is log-likelihood and k is number of parameters in the model (including variables and intercept).
Similarly, BIC is given by: BIC = -2L + k log (n)
Where L is log-likelihood, k is number of parameters (including intercept), and n is number of rating classes or number of model observations.20
The commonest criterion for evaluating a statistical model’s performance is based on its accuracy in fitting the data. The MSE is a widely used measure of accuracy, where a smaller value indicates a more accurate and reliable model.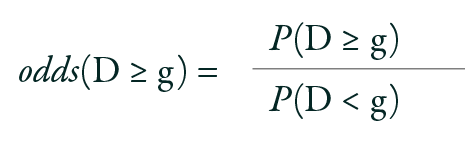
Where n represents the sample size.
For the initial simulation study, we assessed the models under varying sample sizes. To assess how well the GP model and ordinal model fit data exhibiting varying degrees of zero inflation (10%, 20%, 30%, 40%, and 50%), we generated five simulated datasets with varying sample sizes (100, 250, 500, 750, and 1000) while maintaining fixed regression estimates (intercept = 0.5 and slope = 1). The independent variable x was generated from binomial distribution with n observations. Additionally, an error was generated with a mean of zero and a variance of 0.03. Using this independent variable x and the error term, the dependent variable was generated as a linear combination with fixed regression estimates (intercept = 0.5 and slope = 1). This resultant mean was considered as the population mean. The antilog of the predicted estimate from the regression equation represented the mean. Using this mean, the dependent variable (y) was generated using the package ZIP (gamlss.dist) in R software. Subsequently, the dependent variable (y) and independent variable (x) were combined. The GP model and OLR model were then compared across varying proportions of zeros and different sample sizes. This entire process was repeated 1000 times, and the median values of fit statistics were reported in the Simulation Table 1. Model comparison was based on bias, MSE, AIC, and BIC, where the better model exhibited smaller AIC, BIC, Bias, and MSE values.
Table 1: Simulation based on zero-inflated Poisson.
|
10% zeros
|
|
100
|
-2.42E-09
|
2.87
|
365
|
373
|
1.86
|
6.86
|
368
|
393
|
|
250
|
-1.49E-09
|
2.94
|
908
|
919
|
2.03
|
7.50
|
911
|
949
|
|
500
|
-1.08E-09
|
2.96
|
1813
|
1826
|
2.09
|
7.72
|
1817
|
1864
|
|
750
|
-7.85E-10
|
2.97
|
2714
|
2727
|
2.11
|
7.85
|
2718
|
2772
|
|
1000
|
-8.37E-10
|
2.97
|
3621
|
3635
|
2.10
|
7.84
|
3623
|
3682
|
|
20% zeros
|
|
100
|
-7.23E-09
|
3.15
|
363
|
371
|
2.01
|
7.43
|
364
|
388
|
|
250
|
-2.08E-09
|
3.26
|
903
|
914
|
2.05
|
7.60
|
901
|
938
|
|
500
|
-1.35E-09
|
3.27
|
1805
|
1817
|
2.08
|
7.69
|
1794
|
1841
|
|
750
|
-7.09E-09
|
3.28
|
2703
|
2717
|
2.08
|
7.69
|
2686
|
2740
|
|
1000
|
-7.71E-10
|
3.28
|
3607
|
3622
|
2.08
|
7.70
|
3582
|
3641
|
|
30% zeros
|
|
100
|
-3.68E-09
|
3.32
|
351
|
360
|
2.01
|
7.46
|
350
|
374
|
|
250
|
-2.47E-09
|
3.42
|
876
|
887
|
2.06
|
7.68
|
867
|
903
|
|
500
|
-1.55E-09
|
3.42
|
1749
|
1761
|
2.06
|
7.66
|
1726
|
1772
|
|
750
|
-1.32E-09
|
3.44
|
2621
|
2635
|
1.96
|
7.44
|
2586
|
2640
|
|
1000
|
-1.21E-09
|
3.43
|
3493
|
3508
|
1.95
|
7.44
|
3443
|
3500
|
|
40% zeros
|
|
100
|
-4.08E-09
|
3.33
|
332
|
339
|
2.36
|
8.90
|
328
|
351
|
|
250
|
-2.63E-09
|
3.44
|
826
|
836
|
2.48
|
10.00
|
812
|
848
|
|
500
|
-1.87E-09
|
3.42
|
1647
|
1660
|
2.50
|
10.17
|
1615
|
1662
|
|
750
|
-1.43E-09
|
3.44
|
2464
|
2469
|
2.49
|
10.22
|
2415
|
2478
|
|
1000
|
-1.10E-09
|
3.44
|
3288
|
3302
|
2.50
|
10.25
|
3218
|
3276
|
|
50% zeros
|
|
100
|
-3.48E-09
|
3.21
|
303
|
311
|
2.20
|
8.37
|
297
|
320
|
|
250
|
-2.49E-09
|
3.29
|
754
|
764
|
2.25
|
8.67
|
736
|
771
|
|
500
|
-1.75E-09
|
3.28
|
1515
|
1510
|
2.25
|
8.69
|
1464
|
1510
|
|
750
|
-1.48E-09
|
3.29
|
2246
|
2242
|
2.25
|
8.68
|
2190
|
2260
|
MSE: mean square error; AIC: Akaike Information Criteria; BIC: Bayesian Schwartz Information Criteria.
Three real-time studies were used including: 1) Fir, 2) decayed, missing, and filled teeth (DMF), and 3) acute diarrheal disease (ADD). Multiple datasets were chosen to apply GP and OLR models to scenarios ranging from small to large numbers of observations.
The "Fir" dataset was sourced from R’s ‘boot package’ and contained 50 observations. This study aimed to tally the number of balsam-fir seedlings within all quadrants of grid of a 50 five-foot square grid.21 The DMF study constituted a cross-sectional analysis of 440 children’s caries. Its objective was to elucidate the oral health status and preventive dental habits of children across different age groups. The DMF count distribution was skewed positively due to the high incidence of zero counts among children without caries experience.22 The ADD dataset, comprising 3720 cases, was reported from Chennai’s communicable disease hospital from 2008 to 2010. This data was extracted from patients’ case histories across 155 wards in Chennai.
Results
The simulation results presented in Table 1 indicate the performance of the GP and OLR models across varying sample sizes and proportions of zeros. The following observations were made based on these results.
Sample size 100: The GP model generally exhibited lower bias, MSE, and BIC estimates than the OLR model. AIC values were slightly lower at the 30%, 40%, and 50% of the zeros in the OLR model, but not significantly. The details of the preference of a better model based on AIC value were presented in the methods.
Sample size 250: Similar to the sample size 100, the GP model yielded lower values for bias, MSE, and BIC, with slightly lower AIC values in the OLR model.
Sample size 500 and 750: The bias, MSE, and BIC estimates were lower in the GP model, while the AIC values were either lower or not significantly different in the OLR model.
Sample size 1000: The GP model consistently showed lower bias, MSE, and BIC estimates compared to the OLR model. However, the AIC values were lower in the OLR model for this sample size.
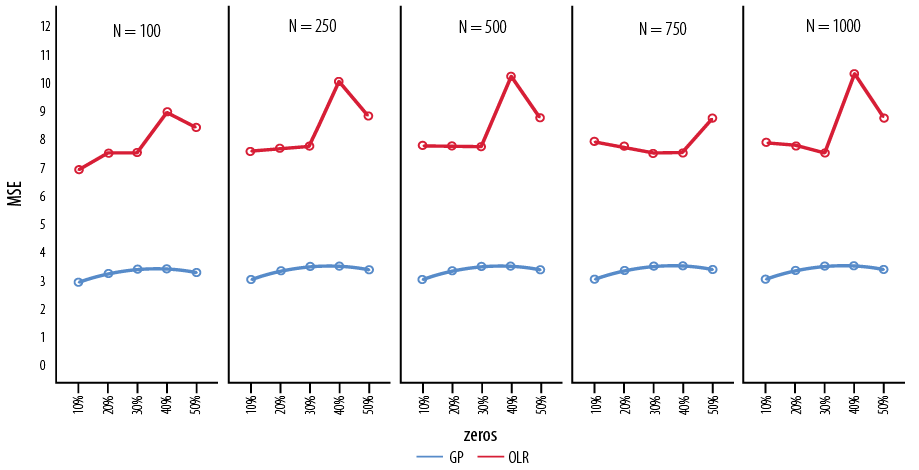
The GP model consistently provided lower bias and MSE values compared to the OLR model across various sample sizes and proportions of zeros. The BIC estimates were generally lower in the GP model, except for specific cases in the sample size 1000 and zeros at 30% and 40%. The AIC values were mostly slightly lower in the OLR model or nearly equal in both models. Figures 1 and 2 visually represent the variation of BIC and MSE with different sample sizes and proportions of zeros. The AIC values were slightly lower in OLR or almost equal in both models.
 GP: generalized Poisson, OLR: ordinal logistic regression
Figure 1: Bayesian Schwartz Information Criteria (BIC) with varying sample sizes and varying proportions of zeros.
 GP: generalized Poisson, OLR: ordinal logistic regression.
Figure 2: Mean square error (MSE) with varying sample sizes and varying proportions of zeros.
The results from three real-time studies are shown in Table 2. The mean (variance) of the studies fir, DMF and ADD were 2.1 (2.4), 3.4 (25.9) and 1.7 (19.5), respectively. The proportion of observed zeros of the outcome was 14%, 45.5% and 60% in the fir, DMF and ADD studies, respectively. The outcome of studies were over-dispersed and inflated by zeros according to Poisson model.
Table 2: Results from three real-time data.
|
Fir
|
50
|
- 0.021
|
0.073
|
184
|
190
|
- 0.130
|
0.183
|
188
|
201
|
|
DMF
|
440
|
- 0.052
|
0.123
|
1937
|
2009
|
- 0.083
|
0.174
|
1997
|
2031
|
SE: standard error; AIC: Akaike Information Criteria; BIC: Bayesian Schwartz Information Criteria; DMF: decayed, missing, and filled teeth; ADD: acute diarrheal disease.
Fir data: The Fir dataset (50 observations) demonstrated lower regression coefficients, standard errors (SE), AIC, and BIC values in the GP model compared to the OLR model.
DMF data: In the DMF dataset (440 observations), the GP model showed lower regression coefficients and SE for the gender variable, along with lower AIC and BIC values.
ADD data: The ADD dataset (3720 observations) also displayed lower regression coefficients and SE for the gender variable in the GP model, alongside lower AIC and BIC estimates.
Across all three real-time datasets, the GP model consistently yielded lower SE, suggesting better precision than the OLR model. The OLR model tended to overestimate regression estimates compared to the GP model. Furthermore, the AIC and BIC values consistently favored the GP model over the OLR model, indicating a better model fit in terms of these criteria.
Discussion
Researchers commonly use OLR for outcomes that are count variables. In nature, the count outcome is ordinal in structure.9 In such situations, it is ideal to fit models that are suitable for ordinal data with or without zeros. While there are many models available for count data analysis, it is important to find which model fits the data well in terms of AIC, BIC, and other goodness of fit statistics.
Ordinal regression models have a long-standing history in statistics, offering flexibility in modeling ordinal count outcomes and in aiding model selection.23,24 We have suggested a new statistical GP model tailored for over-dispersed count responses inflated by zeros.
Manuguerra and Heller applied ordinal regression to continuous outcomes derived from visual analog scales used in pain assessment.25 A common method for analyzing visual analog scales responses involves grouping and treating them as discrete ordinal responses. This study also assessed the health-related quality of life in breast cancer patients after chemotherapy, utilizing Linear Analog Self-Assessment scales. Pain assessment outcomes were analyzed in two ways: ordinal responses using an ordinal model, and continuous responses employing a parametric g function. Similarly, the quality of life outcome was compared between parametric and non-parametric g functions. The GP model emerges as a suitable alternative for such response types.
Kelley and Anderson introduced a mixture model for zero-inflated ordinal outcomes resulting from “never” responses.18 They compared the effectiveness of different models, including PO, partial PO, and ZIPO, using real-time alcohol consumption data. The AIC value was slightly lower in the ZIPO model. In our earlier work on simulation and real-time studies, GP was a better model for zero-inflated outcome compared with mixture Poisson, mixture negative binomial, and ZIP in terms of fit statistics.15 However, this study compared the performance of GP with OLR, and it has shown that the GP model is better as compared to the OLR model.
Our objective was to present a suitable method that enables researchers to more accurately analyze ordinal response outcomes using the GP model. GP could be a better alternative to the ordinal model. Limited studies have explored the application of ordinal models to count data. Our research consistently demonstrates the GP model's superiority to the OLR model, across both real and simulated data.
Our study acknowledges certain limitations, such as the absence of integration of the GP regression method into standard software like SPSS, which may require researchers to use R or Python. Furthermore, the reasons behind divergent findings in cases involving 1000 observations with outcome proportions of 30% and 40% remain unexplained. The scarcity of comparable studies also poses a limitation.
Conclusion
The GP model consistently outperforms the OLR model in terms of bias, MSE, and BIC estimates. The AIC estimates were almost similar or slightly lower in the OLR model. Despite the ease of use of the OLR model, the proposed GP model is recommended due to its better modeling accuracy and interpretation. Our study suggests that the GP model is a superior choice for analyzing ordinal count data compared to the OLR model, offering improved accuracy and ease of interpretation.
Disclosure
The authors declared no conflicts of interest. No funding was received for this study.
references
- 1. Valle D, Ben Toh K, Laporta GZ, Zhao Q. Ordinal regression models for zero-inflated and/or over-dispersed count data. Sci Rep 2019 Feb;9(1):3046.
- 2. Joe H, Zhu R. Generalized Poisson distribution: the property of mixture of Poisson and comparison with negative binomial distribution. Biom J 2005 Apr;47(2):219-229.
- 3. Lachenbruch PA. Analysis of data with excess zeros. Stat Methods Med Res 2002 Aug;11(4):297-302.
- 4. Mullahy J. Much ado about two: reconsidering retransformation and the two-part model in health econometrics. J Health Econ 1998 Jun;17(3):247-281.
- 5. Wang W, Famoye F. Modeling household fertility decisions with generalized Poisson regression. J Popul Econ 1997 Aug;10(3):273-283.
- 6. Yusuf OB, Ugalahi LO. On the performance of the Poisson, negative binomial and generalized Poisson regression models in the prediction of antenatal care visits in Nigeria. American Journal of Mathematics and Statistics 2015;5(3):128-136.
- 7. Armstrong BG, Sloan M. Ordinal regression models for epidemiologic data. Am J Epidemiol 1989 Jan;129(1):191-204.
- 8. Das S, Rahman RM. Application of ordinal logistic regression analysis in determining risk factors of child malnutrition in Bangladesh. Nutr J 2011 Nov;10(1):124.
- 9. Liu Q, Shepherd BE, Li C, Harrell FE Jr. Modeling continuous response variables using ordinal regression. Stat Med 2017 Nov;36(27):4316-4335.
- 10. Forrest M, Andersen B. Ordinal scale and statistics in medical research. Br Med J (Clin Res Ed) 1986 Feb;292(6519):537-538.
- 11. LaValley MP, Felson DT; LaValleyMP. Statistical presentation and analysis of ordered categorical outcome data in rheumatology journals. Arthritis Rheum 2002 Jun;47(3):255-259.
- 12. Avram MJ, Shanks CA, Dykes MH, Ronai AK, Stiers WM. Statistical methods in anesthesia articles: an evaluation of two American journals during two six-month periods. Anesth Analg 1985 Jun;64(6):607-611.
- 13. Scott SC, Goldberg MS, Mayo NE. Statistical assessment of ordinal outcomes in comparative studies. J Clin Epidemiol 1997 Jan;50(1):45-55.
- 14. Ananth CV, Kleinbaum DG. Regression models for ordinal responses: a review of methods and applications. Int J Epidemiol 1997 Dec;26(6):1323-1333.
- 15. Yadav B, Jeyaseelan L, Jeyaseelan V, Durairaj J, George S, Selvaraj KG, et al. Can generalized Poisson model replace any other count data models? An evaluation. Clin Epidemiol Glob Health 2021;11:100774 .
- 16. Cameron AC, Trivedi PK. Regression analysis of count data. Cambridge university press; 2013.
- 17. Harris T, Yang Z, Hardin JW. Modeling underdispersed count data with generalized Poisson regression. Stata J 2012 Dec;12(4):736-747.
- 18. Kelley ME, Anderson SJ. Zero inflation in ordinal data: incorporating susceptibility to response through the use of a mixture model. Stat Med 2008 Aug;27(18):3674-3688.
- 19. Kleinbaum DG, Klein M. Logistic regression. Springer: New York; 2010.
- 20. Hilbe JM. Negative binomial regression. 2nd ed. Cambridge University Press, Cambridge;2011.p. 70-73.
- 21. Davison AC, Hinkley DV. Bootstrap methods and their application.Cambridge University Press; 2013.
- 22. Hofstetter H, Dusseldorp E, Zeileis A, Schuller AA. Modeling caries experience: advantages of the use of the hurdle model. Caries Res 2016;50(6):517-526.
- 23. Agresti A. Introduction to categorical data analysis. 3rd ed. Hoboken, NJ: John Wiley & Sons; 2019.
- 24. McCullaghP. Regression models for ordinal data. J R Stat Soc B 1980;42(2):109-127.
- 25. Manuguerra M, Heller GZ. Ordinal regression models for continuous scales. Int J Biostat 2010;6(1):14.