Overcrowding in emergency departments (EDs) is a worldwide phenomenon and is associated with increased mortality.1 ED overcrowding is defined as “a situation where the demand for emergency services exceeds the ability to provide care in a reasonable amount of time.”2 This has multiple negative consequences which can be divided into patient, staff, or system level effects.3
Effects on patients include a delay in assessment and delivery of care,4–8 increased medication errors,9,10 poor patient outcomes,11,12 increased mortality, and poor patient satisfaction.13–16
Effects on staff working in ED include non-compliance to good medical practice, increased workload both in numbers and acuity, increased stress, burnout, and often violence towards staff.11,17–19
However, most often, a crowded ED is a reflection of a crowded healthcare system.20 A crowded system also results an increased ED stay and inpatient stay leading to a vicious cycle of worsening ED crowding.8,21–23 Different strategies have been adopted to improve patient flow in the ED. Studies looking at fast-track and Urgent Care Centre (UCC) services report a reduction in ED stay for low acuity patients, and ultimately improved ED flow.18,24
See and treat (ST) clinics are a similar concept. They aim to evaluate and treat patients with minor complaints as soon as they arrive, and are based on the principle that one clinician sees, treats, and disposes the patient after an initial assessment.25 This approach has been promoted since 2002 as a method to address many of the problems arising from waiting times in EDs.26,27 The available literature on ST clinics confirms their effectiveness in reducing patient waiting time, length of stay (LoS), and the number of patients that leave without being seen, as well as improving patient satisfaction.26–28 To the best of our knowledge, there is no data looking at ST clinic performance in the UAE. Hence, the goal of this study was to evaluate the performance of our ST clinic and thereby assess its impact on crowding at a tertiary hospital ED in Abu Dhabi.
Methods
We conducted a retrospective electronic healthcare record review of ST clinic patients treated in the ED in a 380-bed tertiary care center in Abu Dhabi. The ED comprises 42 beds of which the main department has 34, whereas the co-located UCC has eight beds. We consult approximately 100 000 patients per year.
On 1 June 2016, the ED underwent a reconfiguration of clinical streaming of patients and a number of strategies were implemented to improve patient flow and key performance indicators (KPIs). The establishment of a ST clinic was one such strategy. The clinic is located at the ED front door entrance immediately adjacent to the triage room. All patients who arrive at ED are welcomed by a visual triage nurse, who assigns them to the next available ED physician.
To assist the visual triage nurse in selecting suitable patients for the ST clinic, we employed the following criteria based on our patient case mix: requests for repeat prescriptions, a complaint lasting more than two weeks, referral from an outpatient department not regarded as an emergency, and any complaint that did not appear to require labs or imaging as per the nurse’s discretion. At the ST clinic, patients are formally triaged according to the ‘Emergency Severity Index’. The patient is then consulted, investigated, treated, admitted, or discharged by one physician. If the physician decides that the patient requires laboratory investigation or imaging, the patient is assigned to a different treatment area within the ED to be evaluated.29 To tide over peak attendances and workforce resources, the clinic is operational 12 hours a day, from 12 pm to 24 am.
Another ED flow strategy implemented was setting up a co-located UCC, adjacent to the main ED. The UCC is staffed by a general practitioner and operates for 12 hours a day from 2 pm to 2 am. The visual triage nurse usually sends otherwise healthy patients aged over 10 years with lacerations or potential fracture to be assessed and treated at the UCC.
Triage level 4 (T4) and triage level 5 (T5) patients are only placed and evaluated in the main ED area when empty beds are available to avoid the crowding of patients in one area, which can create an access block for other high acuity patients.
We included all T4 and T5 triaged patients treated at the ST clinic in addition to all treated in other ED areas from 1 June 2016 to 30 June 2017 (13 months) in this study. Patients were excluded if they left without being seen by the doctor (LWBS) or left against medical advice.
We split our areas of interest into process measures, reflecting the process of the patient journey through our ED system and outcome measures, reflecting the overall experience of the patient.
The process measure recorded was the waiting time to see a doctor (i.e., door-to-doctor time), which reflects the performance of our emergency care system. The outcome measures recorded were door-to-door time (i.e., the transit time of stay in ED, unplanned return within 72 hours, and feedback from T4 and T5 triaged patients) reflecting the quality of care provided. These measures were compared for patients attending the ST clinic, UCC, and other areas of the ED.
Door-to-doctor time was defined as the time interval from registration to initial contact by a physician. Door-to-doctor time was the LoS in the ED, defined as the time interval from registration to discharge disposition time.
Data was collected retrospectively from the Health Information Management Department with the assistance of a designated data coordinator who had access to all electronic healthcare records. The author provided the exact variables to be captured and we piloted data extraction a priori to suggest alternatives in case the required variables were not codified to be captured. Data regarding patient demographics, triage level, door-to-doctor time, total LoS, laboratory or imaging investigations, diagnosis on the first visit, disposition on the first visit, return within 72 hours, diagnosis on return, and disposition on return were extracted for analysis.
In addition to this, a retrospective electronic medical record review was conducted to record the number of unplanned returns within 72 hours. Feedback was requested from the Patient Experience and Quality Department regarding patient experiences. We used Microsoft Excel® for data entry and simple descriptive statistics for data analysis.
We used the Shapiro-Wilk test to determine the normality of data, which we found to be non-parametric. Subsequently, a two-tailed Mann-Whitney test was used to calculate p-values and confidence intervals (CIs).
Institutional Research Ethics Committee approval was obtained before data collection. Informed consent is included in the general hospital consent form signed by all patients at registration in the ED. Ethical principles were applied to the storage, security, and destruction of the excel data collection sheets.
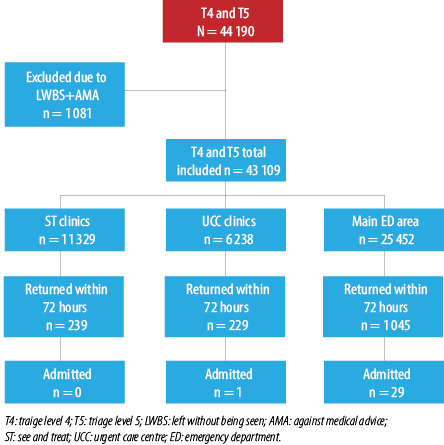
Figure 1: A schematic summary of the number, return, and disposition of the study participants.
Results
A total of 44 190 emergency severity index (ESI) triage category T4 and T5 patients were treated in our ED during the study period either at the ST clinic, UCC, or the main ED. We excluded 1081 patients who left without being seen or against medical advice. The total number of patients enrolled in the study was 43 109. Of these, 11 329 patients were treated at the ST clinic (26.3%), 6328 (14.7%) were treated at the UCC, and 25 452 patients (59.0%) were treated at the main ED [Figure 1]. Among the patients enrolled, 94.0% were T4, and 6.0% were T5 patients. The age range for the T4 and T5 patients was broad (9 months–108 years). We restricted treatment to patients older than 10 years at the UCC and patients younger than 65 years at both the ST and UCC. As demonstrated in Table 1, we observed a male predominance, with men comprising 60.0% of patients. There was no difference in the gender ratio at the ST and main ED areas, but the UCC had a low number of female patients (5.1%). We do not send women with obstetric, gynecologic, or breast complaints to the UCC as the gynecology room setup for examinations is in the main ED. Table 2 presents the chief complaints recorded in the database for patients seen at the ST clinic. For technical reasons, 40.0% of the chief complaints in the database were retrieved. We felt this percentage was an adequate representation of the total ST clinic population. Most patients seen at the ST clinic presented with musculoskeletal pain (22.0%) followed by upper respiratory tract infection (16.0%) and injury and lacerations (12.0%). Table 3 shows the discharge diagnosis for the study sample seen at the three ED locations (ST, UCC, and main ED) on the first visit.
Table 1: Baseline characteristic of study participants (N = 43 109).
|
Age range |
9 months-95years |
12 months-103 years |
7 months-108 years |
|
Male |
6800 (60.0% of ST)
(15.8% of total sample) |
4132 (65.3% of UCC)
(9.6% of total sample) |
14 889 (58.5% of ED)
(34.5% of total sample) |
|
Female |
4529 (40% of ST)
(10.5% of total sample) |
2196 (35.7% of UCC)
(5.1% of total sample) |
10 563 (41.5% of ED)
(24.5% of total sample) |
|
Pediatric ≤ 16 years |
3141 (27.7%)
(7.3% of total sample) |
680 (10.7%)
(1.6% of total sample) |
13 777 (54.1%)
(32.0% of total sample) |
ST: see and treat; UCC: urgent care center; ED: emergency department.
Our ST clinic had a door-to-doctor time of within 30 minutes for 89.0% of patients, and a door-to-door time of within two hours for 94.0% of patients. For patients presenting to UCC and other parts of our ED, we recorded a door-to-doctor time of within 30 minutes for 80.5% of patients, and a door-to-door of within two hours for 73.0% of patients. ST clinic had 2.0% unplanned returned patients within 72 hours. However, none of these patients were admitted on their return visit comparing to other ED areas where 4.0% had unplanned returned patients within 72 hours; and 31 patients were admitted at the return visit.
Table 2: Chief complaints in See and Treat clinic patients (n = 4305).
|
Musculoskeletal pain |
22.0 |
|
Upper respiratory tract infection |
16.0 |
|
Minor trauma and laceration |
12.0 |
|
Fever |
8.0 |
|
Assault |
4.0 |
|
Eye pain |
3.0 |
|
Ear pain |
3.0 |
Table 3: Discharge diagnosis on the first visit.
|
Trauma and soft tissue injuries |
28.6% |
27.0% |
19.8% |
|
Respiratory |
19.4% |
15.0% |
27.5% |
|
Orthopedic and rheumatology |
18.0% |
18.1% |
10.3% |
|
Infections |
7.0% |
8.0% |
11.5% |
|
Ophthalmology |
4.2% |
3.8% |
3.5% |
|
Dermatology |
4.1% |
2.5% |
2.9% |
|
Other1 |
4.1% |
5.8% |
3.9% |
|
Ear/nose/throat |
3.5% |
2.3% |
4.2% |
|
Gastrointestinal |
3.5% |
8.5% |
7.7% |
|
Neurology |
3.1% |
4.6% |
2.5% |
|
Dental |
1.7% |
0.8% |
2.4% |
|
Obstetrics and gynecology |
0.8% |
0.8% |
0.8% |
|
Cardiovascular |
0.7% |
0.4% |
0.7% |
|
Genitourinary |
0.6% |
1.7% |
1.6% |
|
Hematology and oncology |
0.3% |
0.2% |
0.3% |
ST: See and treat; UCC: urgent care center; ED: emergency department.
1Other (cast or wound re-evaluation, repeat prescription, immunization, medicolegal examination, drug adverse events, psychiatry, pain and fatigue, excessive child crying, gastrostomy, colostomy, nasogastric tube, and Foley catheter evaluation).
Table 4: Analysis of return within 72 hours.
|
ST clinic |
|
|
Cast or wound re-evaluation and repeat prescription |
25.0 |
|
Upper respiratory tract infection |
24.0 |
|
Minor trauma and soft tissue injuries1 |
21.0 |
|
Other2 |
16.0 |
|
Musculoskeletal and back pain |
14.0 |
|
UCC clinic |
|
|
Cast or wound re-evaluation, repeat prescription, and immunization |
26.0 |
|
Upper respiratory tract infection |
18.0 |
|
Other3 |
18.0 |
|
Musculoskeletal and back pain |
17.0 |
|
Minor trauma and soft tissue injuries |
11.0 |
|
Abdominal pain |
10.0 |
|
Main ED |
|
|
Respiratory related (URTI, LRTI, SOB, and asthma) |
22.0 |
|
Cast or wound re-evaluation, repeat prescription, and immunization |
17.0 |
|
Constitutional (fever, dehydration, pain, jaundice, bacteremia) |
14.0 |
|
Other4 |
13.0 |
|
Minor trauma and soft tissue injuries |
12.0 |
|
Musculoskeletal and back pain |
9.0 |
|
Dermatology (rash and cellulitis) |
7.0 |
1Wounds and fracture.
2Dental 4.0%, rash 3.0%, ENT 3.0%, headache 2.0%, ophthalmologic 2.0%, abdominal pain 1.0%, and foreign body 1.0%.
3Bronchitis 5.0%, fever 4.0%, cellulitis 2.0%, ENT 2.0%, ophthalmologic 2.0%, rash 1.0%, and dental 1.0%
4Genitourinary 4.0%, ophthalmologic 2.0%, ENT 2.0%, neurology 2.0%, dental 1.0%, obstetrics and gynecology 1.0%, and medicolegal 1.0%.
ST: see and treat; UCC: urgent care center; ED: emergency department; UTRI: upper respiratory tract infection; LRTI: lower respiratory tract infection; SOB: shortness of breath; ENT: ear, nose, and throat.
Using the two-tailed Mann-Whitney test, we found the difference in waiting times (i.e., door-to-doctor times between ST clinic patients and the rest of ED) to be statistically significant (p < 0.001, 95% CI: 0.56–0.63). However, on comparing door-to-door times, we found no significant difference between ST clinic patients and the rest of ED patients (p = 0.670, 95% CI: 0.47–to 0.54).
When assessing patient access and door-to-doctor time, we found that 89.0% of patients were seen within 30 minutes of registration, and by one hour 97.0% of patients had been seen. Regarding door-to-door time, 94.0% of patients were discharged within two hours. The mean LoS time for the ST clinic was 55.0 minutes, and the median time was 45 minutes. The rate of admission from ST clinic on the first visit was negligible (0.2%, 17/11 329). Of these 17 patients, eight were admitted because of a distal extremity fracture that required surgical management. The number of patients who were seen at the ST clinic and had an unplanned return within 72 hours was 239 (2.1%); 78.7% (188 patients) returned for an issue related to their first visit complaint, and 20.9% (50 patients) presented with an unrelated chief complaint. None of the patients who returned within 72 hours needed to be admitted. Table 4 shows an analysis of the patients that returned within 72 hours. Compared to other areas in the ED, only 3.1% had laboratory investigations and 0.2% had radiological imaging conducted for the ST patients.
Analysis of UCC patient access and door-to-doctor time revealed that 92.0% of patients were seen within 30 minutes, and 98.0% were seen within one hour; 80.0% of UCC patients were discharged within two hours. A door-to-door LoS of within two hours for 80.0% of patients was recorded with the mean LoS being 86.0 minutes and the median LoS being 77 minutes. The rate of admission from UCC on the first visit was 0.4% (23/6328). The rate of unplanned return within 72 hours was 3.6% (229/6328), and 78.2% (179) of the patients returned for an issue related to their first visit, whereas 21.8% (50 patients) returned for a different issue. One patient was admitted at their return visit. Table 4 shows information on the return diagnosis; 12.0% had laboratory investigations and 1.1% had radiological imaging performed for the UCC patients.
A door-to-doctor time was achieved for 69.0% of triaged T4 and T5 patients seen in the main ED, although 84.0% were seen within one hour. The door-to-door LoS time of two hours was achieved for 69.0% of patients. The mean LoS was 103.0 minutes, and the median LoS was 88 minutes. One percent (255) of patients was admitted on the first visit, and 4.1% (1045 patients) returned within 72 hours, which is similar to the UCC return rate. Among these patients, 82.0% (857 patients) returned for an issue related to their first visit diagnosis and 18.0% (188 patients) returned for a different issue. Table 5 shows information on the return diagnosis. Twenty nine patients were admitted at the return visit. Table 5 shows that among patients admitted on the return visit at the main ED, 15.0% had laboratory investigations and 2.0% had radiological investigations performed.
Patient satisfaction data was difficult to extract in retrospect as the data is archived centrally at the corporate headquarters. However, verbal compliments for the ST clinic are often received from patients, many of whom preferentially choose to be seen at the ST clinic.
Table 5: Analysis of the admission diagnosis on the unplanned return to the main ED within 72 hours.
|
Pain around the eye in a 30-year-old male |
Glaucoma |
1 |
|
Pediatric |
|
21 |
|
Fever |
Bronchiolitis |
5 |
|
Fever |
Urinary tract infection |
1 |
|
Fever |
Pharyngitis |
1 |
|
Fever |
Fever |
1 |
|
Fever |
Viral meningitis |
1 |
|
Fever |
Ulcerative stomatitis |
1 |
|
Gastritis |
Dehydration |
4 |
|
Lymphadenitis |
Lymphadenitis |
1 |
|
URTI |
Varicella |
1 |
|
Open hand-wound |
Infection of the open hand-wound |
1 |
|
Urticaria |
Urticaria |
1 |
|
Displaced phalanx fraction |
Displaced phalanx fracture |
1 |
|
Cough |
Aspiration |
1 |
|
Burn to hand |
Burn to hand |
1 |
|
Pregnant |
|
3 |
|
Obstetric surgical wounds in two patients |
Obstetric surgical wound infection |
2 |
|
Acute pharyngitis in pregnancy |
To rule out H1N1 |
1 |
|
Elderly |
|
4 |
|
Headache |
To rule out sinister cause |
1 |
|
Fever |
Urinary tract infection |
1 |
|
Lumbar pain |
Sciatica |
1 |
URTI: upper respiratory tract infection.
Discussion
ST clinic analysis has shown that 89.0% of patients saw a doctor within 30 minutes, and 94.0% of patients were safely disposed within two hours, reducing their LoS and improving ED flow. Upon analyzing unplanned return within 72 hours for ST patients, none needed admission, which correlates with good medical practice being adhered to in ST clinics. We feel that having a ST clinic located next to the ED triage allows for a timely assessment, management, and disposal of low-risk attendance.
A retrospective study by Di Somma et al,2 evaluated the effectiveness of ST clinics on waiting times and LoS for patients visiting EDs worldwide; 90% of patients in this study saw a doctor within one hour, and 41% were discharged within one hour. In our study, 97.0% of patients were seen within one hour, 67.0% were discharged within one hour, and 94.0% were discharged within two hours.
In June 2016, multiple strategies were implemented in our hospital ED as part of a clinical streaming re-structuring project. A ST clinic was implemented to enhance patient access, reduce door-to-doctor time, and patient LoS in the ED as well as to improve the experience of triage T4 and T5 patients.
According to our KPI, the recommended door-to-doctor time for T4 and T5 triaged patients is 30 minutes and 40 minutes, respectively. The recommended LoS in the ED for T4 and T5 patients is two hours.
The door-to-doctor time at the ST clinic was shorter than the time at the UCC and main ED areas. This is likely attributed to many factors like the low acuity of the attending patients, a dedicated workforce for these patients not pre-occupied with other potentially sicker patients, the strategic location of the clinic at the front door, and the setup of the clinic where the physicians see one patient at a time reducing cognitive overload from managing multiple patients contemporaneously in the ED.
Additionally, the door-to-door time for ST clinic patients was better than the time for the UCC and the main ED patients, although we acknowledge this was not significant. Though the ST clinic and UCC serve similar patient populations, the visual triage nurses at the ST clinic were instructed to select patients with chief complaints unlikely to require additional investigations, facilitating efficient patient turnover.
Analysis of the return visits at the three ED areas showed that unplanned return was primarily due to the progression of the primary complaint, with upper respiratory tract infection being the main culprit, followed by cast or wound re-evaluation, repeat prescription requests, and pain management after sustaining minor trauma related to the first visit. Investing in patient discharge information may help reduce unplanned return rates for patients with upper respiratory tract infection. Additionally, optimizing pain management after minor trauma on the patient’s first visit can reduce the return rates for pain.
The ST clinic and UCC had negligible admission rates on the return visit (except for one patient), demonstrating they are indeed safe and that our visual triage criteria to select patients for those two areas were valid. Admission on the return visit in the main ED area was limited to special populations (pediatrics, pregnant, and elderly) who are more likely to experience disease progression.
To our knowledge, this is the first study looking at a ST clinic and its impact on the ED in the UAE and the region. The study elaborated on the waiting times and LoS of patients in ST clinics compared to other areas of the ED and was conducted with a very large sample size of more than 40 000 patients. We performed a comprehensive comparison of ST clinic patients to other emergency care providers in our system, the UCC, and the main ED.
Our study has many limitations. It was a single-center study with retrospective patient enrolment. Our data collection was dependent on case notes documentation. This made real-time data collection on the patient journey and patient feedback more difficult. Furthermore, we could not consider the outcomes of patients if they were subsequently re-triaged to a different category, although this is not a common occurrence based on the experiences of senior nursing staff in our ED. Our study showed a moderate, albeit positive impact of ST clinics on door-to-door and door-to-doctor times compared to the rest of the ED. While we cannot generalize our results to all triage categories, it would be fair to comment that processing of low acuity T4 and T5 triaged patients would be streamlined in a time resourceful manner using a ST clinic model, in a dedicated clinical area, separate from the rest of the ED and its distractions.
Crowding is a complex area of study, but one that has significant impacts on the flow and mortality of patients. While it is true ED crowding reflects a crowded healthcare system,20 it is useful to split its many plausible solutions into input, throughput, and output remedies.30
Reducing inputs into the ED is out of the prerogative of its staff. However, judicious use of a co-located UCC and the ST clinic helps reduce the burden of at least some patients on the main ED. Diversion of patients arriving by ambulances is another tactic although the safety and efficacy of this strategy remains to be proven.31
Throughput solutions are often complex and multipronged. Front door triage and front loading of investigations is widely used across the UK.32 Having clear pathways and processes within the ED help streamline the flow of our patients.20 In addition, a clinical decision unit for the use of ambulatory care pathways of low-risk conditions allows patients to be directed there rather than the main ED.20
Optimizing the output of patients from the ED requires strategic and operational planning. Structured anticipation of demand can be made using historical data of flow in the area, as is often done at bed meetings. Dedicated bed managers with support from the hospital executive board should monitor patient flow situation reports (SITREP) and prioritize pending transfers from the ED.
Often difficult to define and measure proxy measures are used to measure crowding. Ambulance diversions, ED LoS, delays in seeing an emergency physician, and a high proportion of patients waiting for a bed after a decision to admit are just some of these proxy measures.30,31
Conclusion
Door-to-doctor times were shorter in ST clinics compared to other parts of our ED, but there was no statistically significant difference in door-to-door times when comparing ST clinics to the rest of the ED. ST clinic patients had a lower rate of unplanned return within 72 hours, of which, none required admission on the return attendance. We believe ST clinics have a positive impact on reducing ED crowding but acknowledge they are one of the many plausible solutions attributing to optimized patient flow in the ED. Further multi-center high-quality studies to systematically evaluate and establish the benefit of interventions like ST clinics on flow in EDs are required. Consistent with emergency medicine worldwide, in the UAE, we should recognize and define crowding. A validated metric for its measurement should be designed and used with current datasets.
Disclosure
The authors declared no conflicts of interest. No funding was received for this study.
references
- 1. Bond K, Ospina M, Blitz S, Friesen C, Innes G, Yoon P, et al. Interventions to reduce overcrowding in emergency departments [Technology report no 67.4]. Ottawa: Canadian Agency for Drugs and Technologies in Health; 2006.
- 2. Di Somma S, Paladino L, Vaughan L, Lalle I, Magrini L, Magnanti M. Overcrowding in emergency department: an international issue. Intern Emerg Med 2015 Mar;10(2):171-175.
- 3. Morley C, Unwin M, Peterson GM, Stankovich J, Kinsman L. Emergency department crowding: a systematic review of causes, consequences and solutions. PLoS One 2018 Aug;13(8):e0203316.
- 4. Hwang U, Richardson L, Livote E, Harris B, Spencer N, Sean Morrison R. Emergency department crowding and decreased quality of pain care. Acad Emerg Med 2008 Dec;15(12):1248-1255.
- 5. Gaieski DF, Agarwal AK, Mikkelsen ME, Drumheller B, Cham Sante S, Shofer FS, et al. The impact of ED crowding on early interventions and mortality in patients with severe sepsis. Am J Emerg Med 2017 Jul;35(7):953-960.
- 6. Kulstad EB, Kelley KM. Overcrowding is associated with delays in percutaneous coronary intervention for acute myocardial infarction. Int J Emerg Med 2009 Jun;2(3):149-154.
- 7. Reznek MA, Murray E, Youngren MN, Durham NT, Michael SS. Door-to-imaging time for acute stroke patients is adversely affected by emergency department crowding. Stroke 2017 Jan;48(1):49-54.
- 8. McCarthy ML, Zeger SL, Ding R, Levin SR, Desmond JS, Lee J, et al. Crowding delays treatment and lengthens emergency department length of stay, even among high-acuity patients. Ann Emerg Med 2009 Oct;54(4):492-503.
- 9. Kulstad EB, Sikka R, Sweis RT, Kelley KM, Rzechula KH. ED overcrowding is associated with an increased frequency of medication errors. Am J Emerg Med 2010 Mar;28(3):304-309.
- 10. Lee CC, Lee NY, Chuang MC, Chen PL, Chang CM, Ko WC. The impact of overcrowding on the bacterial contamination of blood cultures in the ED. Am J Emerg Med 2012 Jul;30(6):839-845.
- 11. Diercks DB, Roe MT, Chen AY, Peacock WF, Kirk JD, Pollack CV Jr, et al. Prolonged emergency department stays of non-ST-segment-elevation myocardial infarction patients are associated with worse adherence to the American College of Cardiology/American Heart Association guidelines for management and increased adverse events. Ann Emerg Med 2007 Nov;50(5):489-496.
- 12. Zhou J-C, Pan K-H, Zhou D-Y, Zheng S-W, Zhu J-Q, Xu Q-P, et al. High hospital occupancy is associated with increased risk for patients boarding in the emergency department. Am J Med 2012 Apr;125(4):416.e1-416.e7.
- 13. Guttmann A, Schull MJ, Vermeulen MJ, Stukel TA. Association between waiting times and short term mortality and hospital admission after departure from emergency department: population based cohort study from Ontario, Canada. BMJ 2011 Jun;342:d2983.
- 14. Richardson DB. Increase in patient mortality at 10 days associated with emergency department overcrowding. Med J Aust 2006 Mar;184(5):213-216.
- 15. McCusker J, Vadeboncoeur A, Lévesque J-F, Ciampi A, Belzile E. Increases in emergency department occupancy are associated with adverse 30-day outcomes. Acad Emerg Med 2014 Oct;21(10):1092-1100.
- 16. Tekwani KL, Kerem Y, Mistry CD, Sayger BM, Kulstad EB. Emergency department crowding is associated with reduced satisfaction scores in patients discharged from the emergency department. West J Emerg Med 2013 Feb;14(1):11-15.
- 17. Fee C, Weber EJ, Maak CA, Bacchetti P. Effect of emergency department crowding on time to antibiotics in patients admitted with community-acquired pneumonia. Ann Emerg Med 2007 Nov;50(5):501-509, 509.e1.
- 18. Bond K, Ospina MB, Blitz S, Afilalo M, Campbell SG, Bullard M, et al. Frequency, determinants and impact of overcrowding in emergency departments in Canada: a national survey. Healthc Q 2007;10(4):32-40.
- 19. Medley DB, Morris JE, Stone CK, Song J, Delmas T, Thakrar K. An association between occupancy rates in the emergency department and rates of violence toward staff. J Emerg Med 2012 Oct;43(4):736-744.
- 20. Boyle A, Higginson I, Smith S, Henderson K. Crowding in emergency departments. The College of Emergency Medicine. Revised 2014.
- 21. Wickman L, Svensson P, Djärv T. Effect of crowding on length of stay for common chief complaints in the emergency department: a STROBE cohort study. Medicine (Baltimore) 2017 Nov;96(44):e8457.
- 22. Richardson DB. The access-block effect: relationship between delay to reaching an inpatient bed and inpatient length of stay. Med J Aust 2002 Nov;177(9):492-495.
- 23. Liew D, Liew D, Kennedy MP. Emergency department length of stay independently predicts excess inpatient length of stay. Med J Aust 2003 Nov;179(10):524-526.
- 24. Moineddin R, Meaney C, Agha M, Zagorski B, Glazier RH. Modeling factors influencing the demand for emergency department services in Ontario: a comparison of methods. BMC Emerg Med 2011 Aug;11:13.
- 25. Rogers T, Ross N, Spooner D. Evaluation of a ‘See and Treat’ pilot study introduced to an emergency department. Accid Emerg Nurs 2004 Jan;12(1):24-27.
- 26. Oredsson S, Jonsson H, Rognes J, Lind L, Göransson KE, Ehrenberg A, et al. A systematic review of triage-related interventions to improve patient flow in emergency departments. Scand J Trauma Resusc Emerg Med 2011 Jul;19(1):43.
- 27. Davis R. “See and Treat” or “see” and “treat” in an emergency department Proceedings of the 2007. In proceedings of the 39th conference on Winter simulation: 40 years! The best is yet to come 2007 Dec 9. p. 1519-1522.
- 28. Jarvis PR. Improving emergency department patient flow. Clin Exp Emerg Med 2016 Jun;3(2):63-68.
- 29. Lamont SS. “See and Treat”: spreading like wildfire? A qualitative study into factors affecting its introduction and spread. Emerg Med J 2005 Aug;22(8):548-552.
- 30. Higginson I. Emergency department crowding. Emerg Med J 2012 Jun;29(6):437-443.
- 31. Morris ZS, Boyle A, Beniuk K, Robinson S. Emergency department crowding: towards an agenda for evidence-based intervention. Emerg Med J 2012 Jun;29(6):460-466.
- 32. Initial assessment of emergency department patients. Service design and delivery. The Royal College of Emergency Medicine. 2017 [cited 2018 July]. Available from: http://www.rcem.ac.uk/docs/SDDC%20Intial%20Assessment%20(Feb%202017).pdf.