Diabetes mellitus (DM) is one of the most common chronic metabolic disorders and is caused by either impaired insulin secretion or insulin action, or both.1 The two broad categories of diabetes mellitus are titled as type 1 and type 2 diabetes. Unlike type 1, many type 2 diabetic patients need insulin for their well-being but not for survival.2
Type 1 diabetes mellitus (T1DM) is most often diagnosed in children and adolescents.3 The classical symptoms are polydipsia, polyphagia, and polyuria, as well as hyperglycemia, which initiates the immediate need for exogenous insulin replacement.3 According to the World Health Organization (WHO) classification, T1DM is further divided into two subtypes: autoimmune (type 1A) and idiopathic (type 1B) diabetes.4
The main pathology in T1DM is the destruction of pancreatic beta cells. Immune cells have a critical role in this process, but the precise mechanisms involved in the progression of the disease are still unclear.5 A combination of autoimmune conditions, genetic susceptibility, and environmental factors have been suggested to affect disease development and progression.6,7
Many studies have focused on the role played by T cells in the development and progression of the T1DM as it is the main cell proved to be infiltrating the diabetic pancreas.1 Unlike T lymphocytes, natural killer (NK) cells exert their tasks without the need for previous activation. This important characteristic makes them highly suited to mediate the first line of defense against infection, as part of the innate immune response.8,9 There are many quantitative and qualitative changes in NK cells in diabetic patients.10
Previous studies have revealed a destructive action of the NK cells on pancreatic islet beta cells and their significant involvement in the development of the disease.11,12
The function of NK cells is achieved by a balance between activating and inhibiting receptors so as to sense their environment and differentiate between healthy and diseased cells. It is not known whether a specific receptor by itself is capable of triggering NK cell function. A balanced interaction between various receptors appears to be needed.13
These activating and inhibitory receptors are controlled by certain genes; one of them is KLRC3. KLRC3 is a member of NKG2 family of genes. KLRC3 encodes for NKG2E, which is a significant activating receptor of NK cells.14
The aim of this study was to identify the possible role played by NK cells in T1DM pathogenesis through comparing KLRC3 gene expression between patients with T1DM and healthy controls.
Methods
This study was conducted at the Alexandria University Children’s Hospital from April to October 2015. The study was conducted on 30 patients newly diagnosed with T1DM and 20 non-diabetic subjects serving as a control group (age range: 7–13 years). The included patients were further sub-divided into two groups of 15 patients each; group I included patients who first presented with classical symptoms and group II included patients that first presented with diabetic ketoacidosis (DKA). The diagnosis of T1DM was based on the American Diabetes Association (ADA)2 definition; either a fasting plasma glucose (FPG) ≥ 126 mg/dL or a random plasma glucose ≥ 200 mg/dL in a patient with classic symptoms of hyperglycemia, or glycated heamoglobin (HbA1C) levels ≥ 6.5% and/or a two-hour oral glucose tolerance test (OGTT) > 200 mg/dL. Written informed consent was obtained from all subjects’ guardians enrolled, and the study was approved by the Ethics Committee of Alexandria University.
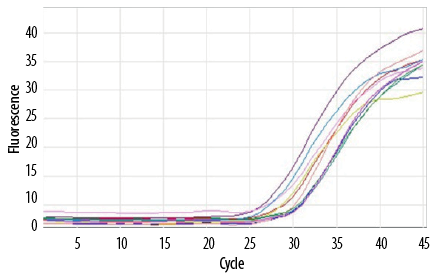
Figure 1: Amplification plot curves for KLRC3 gene expression.
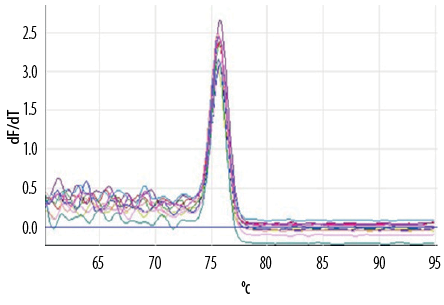
Figure 2: Melting curve for KLRC3 gene.
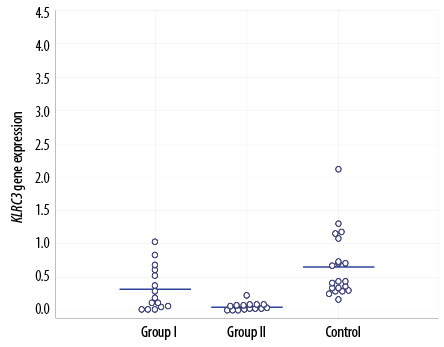
Figure 3: KLRC3 gene expression in the three study groups.
All participants in the current study were subjected to full history taking, physical examination, and laboratory investigations for fasting serum glucose level, HbA1c, fasting C-peptide, and serum pancreatic amylase. Liver and kidney function and a complete blood count (CBC) were also done. Finally, KLRC3 gene expression was done using the real-time reverse transcriptase polymerase chain reaction (RT-PCR). Fresh peripheral blood samples were withdrawn from the patients in all groups under strict aseptic conditions in vacutainer EDTA tubes. Samples were processed within few hours of collection. Purification of total cellular RNA from human whole blood was done using miRNeasy Mini Kit (Qiagen, USA).15 RNA samples were stored at -80 oC until processed. cDNA was synthesized from total RNA using QuantiTect Reverse Transcription Kit.16 KLRC3 gene expression was analyzed by real-time quantitative PCR using real-time cycler Rotor gene Q® (Qiagen, USA) using QuantiTect® SYBR® Green PCR kit.17
The gene expression level was normalized with the values of the housekeeping control gene glyceraldehyde 3-phosphate dehydrogenase (GAPDH).
The results of real-time RT-PCR were represented by the parameter Ct (threshold cycle), Ct is the amplification cycle at which the signal crosses a detection threshold. The difference in Ct values between KLRC3 and GAPDH reactions was given by Delta Ct (∆ Ct).
Amplification plot curve was used to calculate Ct for both KLRC3 and GAPDH. A melting curve was done to increase sensitivity and specificity of the test [Figure 1 and Figure 2].
Statistical analysis was performed using unpaired chi-square, F-test (ANOVA), Mann-Whitney, and Kruskal-Wallis test. Results were considered significant if the p-value was less than 0.050. Statistical analysis was carried out using SPSS Statistics (IBM Corp. Released 2011. IBM SPSS Statistics for Windows, Version 20.0. Armonk, NY: IBM Corp).
Results
Patients in the two diabetic groups included 15 males and 15 females, and the control group included 10 males and 10 females [Table 1]. Patients were aged between 7–13 years. The mean age of group I, II and the control group was 10.6±1.7, 9.7±1.9, and 10.4±2.0 years, respectively. The majority of patients were children (below the age of puberty) and only eight patients were >12 years old.
The three studied groups were matched for age, sex, and family history of diabetes. The most frequent symptoms were polyuria in both groups I and II (100.0% and 73.3%, respectively), followed by polydipsia, and polyphagia [Table 2]. Only five patients presented with fever and influenza-like symptoms before the onset of DKA. Results of routine blood tests were comparable in the three studied groups.
There was no significant difference between groups I and II regarding fasting blood sugar levels. Mean values of HbA1c and C-peptide were higher in group I (p = 0.003 and p = 0.046, respectively). Levels of serum pancreatic amylase were not statistically different in the three groups [Table 3].
KLRC3 gene expression was compared between the two groups and against the control group [Figure 3 and Table 4].
The mean expression levels of KLRC3 receptor for groups I, II, and control group were 0.32±0.33, 0.06±0.06, and 0.66±0.49, respectively. The level was significantly lowest in the group of patients who presented with DKA; group II (p = 0.008).
Table 1: Demographic data of the two diabetic study groups and the control group.
|
Gender |
|
Male |
8 |
53.3 |
7 |
46.7 |
10 |
50.0 |
χ2 = 0.133 |
0.936 |
|
Female |
7 |
46.7 |
8 |
53.3 |
10 |
50.0 |
|
Age, years |
|
< 12 |
11 |
73.3 |
11 |
73.3 |
11 |
55.0 |
χ2 = 4.022 |
0.130MC |
|
> 12 |
4 |
26.7 |
4 |
26.7 |
9 |
45.0 |
|
Min–Max |
7.0–13.0 |
7.0–13.0 |
7.0–13.0 |
|
|
|
Mean ± SD |
10.6±1.7 |
9.7±1.9 |
10.4±2.0 |
F = 4.408* |
0.018* |
|
Median |
11.0 |
9.0 |
10.5 |
|
p-value between groups |
p1 = 0.167KW |
|
p2 = 0.973KW |
|
p3 = 0.259KW |
|
|
|
Family history of diabetes |
|
Negative |
8 |
53.3 |
6 |
40.0 |
20 |
100.0 |
18.749* |
< 0.001* |
|
Positive |
7 |
46.7 |
9 |
60.0 |
0 |
0.0 |
|
p-value between groups, , |
p1 = 0.464 |
|
p2 = 0.001*FE |
|
p3 < 0.001*FE |
|
|
|
Admission to ICU |
|
Negative |
14 |
93.3 |
0 |
0.0 |
20 |
100.0 |
47.909* |
< 0.001* |
|
Positive |
1 |
6.7 |
15 |
100.0 |
0 |
0.0 |
*Statistically significant at p < 0.050; χ2, p: χ2 and p-values for chi-square test; KWp: KW and p-values for Kruskal-Wallis test; p1: p-value for comparing between group I and group II; p2: p-value for comparing between group I group and control; p3: p-value for comparing between group II and control; Group I: outpatient clinic cases; Group II: pediatric intensive care unit (ICU) cases; FE: Fisher Exact test; MC: Mont Carlo test
Table 2: Comparison between the two studied groups according to different clinical symptoms.
|
Polyphagia |
|
|
|
|
15.000* |
< 0.001* |
|
Negative |
5 |
33.3 |
15 |
100.0 |
|
|
|
Positive |
10 |
66.7 |
0 |
0.0 |
|
|
|
Polyuria |
|
|
|
|
4.615 |
0.100FE |
|
Negative |
0 |
0.0 |
4 |
26.7 |
|
|
|
Positive |
15 |
100.0 |
11 |
73.3 |
|
Polydepsia |
|
|
|
|
13.393* |
< 0.001* |
|
Negative |
2 |
13.3 |
12 |
80.0 |
|
|
*Statistically significant at p < 0.050; FE: Fisher Exact test
Table 3: Comparison of fasting blood sugar, HbA1C, C-peptide, and serum pancreatic amylase levels between the study groups.
|
FBS, mg/dL |
|
Min–Max |
95.0–425.0 |
84.0–401.0 |
66.0–92.0 |
KW χ2 = 32.777* |
< 0.001* |
|
Mean ± SD |
211.1 ± 87.5 |
230.5 ± 110.4 |
80.6 ± 7.7 |
|
|
|
Median |
190.0 |
219.0 |
81.0 |
|
|
|
p-value between group |
p1 = 0.663 |
p2 < 0.001* |
|
p3 < 0.001* |
|
|
|
HbA1c, % |
|
Min–Max |
6.2–14.9 |
6.5–11.0 |
3.0–5.5 |
F = 62.642* |
< 0.001* |
|
Mean ± SD |
10.2 ± 2.4 |
8.3 ± 1.4 |
4.4 ± 0.7 |
|
p-value between groups |
p1 = 0.003* |
p2 < 0.001* |
|
p3 < 0.001* |
|
|
|
C-peptide, ng/mL |
|
Min–Max |
0.01–0.93 |
0.01–0.13 |
1.2–4.4 |
KW χ2 = 38.481* |
< 0.001* |
|
Mean ± SD |
0.2 ± 0.3 |
0.02 ± 0.03 |
2.9 ± 1.1 |
|
Median |
0.02 |
0.01 |
2.90 |
|
p-value between groups |
p1 = 0.046* |
p2 < 0.001* |
|
p3 < 0.001* |
|
|
|
Serum pancreatic amylase, U/L |
|
Min–Max |
32.0–67.0 |
34.0–64.0 |
26.0–59.0 |
p1: p-value for comparing between group I and group II; p2: p-value for comparing between group I group and control; p3: p-value for comparing between group II and control; Group I: outpatient clinic cases; Group II: pediatric intensive care unit cases; SD: standard deviation; HbA1c: glycolated heamoglobin; KW χ2: Kruskal-Wallis test; FBS: fasting blood sugar
Table 4: Comparison between the two studied groups and control according to the expression of KLRC3.
|
Threshold |
|
Min–Max |
0.01–1.02 |
0.0–0.22 |
0.16–2.12 |
26.021* |
< 0.001* |
|
Mean ± SD |
0.32 ± 0.33 |
0.06 ± 0.06 |
0.66 ± 0.49 |
|
Median |
0.20 |
0.04 |
0.43 |
Significance between groups was done using Mann-Whitney test. *Statistically significant at p ≤ 0.050.
KWχ2: Kruskal-Wallis test; p1: p-value for comparing between group I and group II; p2: p-value for comparing between group I group and control; p3: p-value for comparing between group II and control; Group I: outpatient clinic cases; Group II: pediatric intensive care unit cases; SD: standard deviation.
Discussion
We found significant downregulation of the KLRC3 gene in patients with diabetes compared to healthy controls. Moreover, KLRC3 showed more downregulation in patients who presented with DKA.
NK cells could be involved in one or several steps of the immune-mediated attack that leads to T1DM.8 Downregulation of the KLRC3 gene may result in abnormal NKG2E receptor expression and, consequently, abnormal NK cells function. NKG2E forms heterodimeric complexes with CD94. These complexes interact with HLA-E, a major histocompatibility complex (MHC) class Ib protein, which is involved in pathogenesis of T1DM.9
In a previous study, KLRC3 was found to be downregulated in patients with T1DM and fulminant type 1 diabetes compared to normal controls.10 Fulminant type 1 diabetes is a clinical subtype of T1DM characterized by rapid onset of hyperglycemic symptoms, DKA at the time of diagnosis, and a fasting serum C-peptide level < 0.3 ng/mL. However, when comparing T1DM to the fulminant type 1 diabetes, there was no significant difference in KLRC3 gene expression. They also found no significant differences in the expression of the other NKG2 family genes that code for NK cell receptors as KLRC2 (NKG2C), KLRC1 (NKG2A), and KLRK1 (NKG2D) when comparing diabetic patients to normal controls suggesting a more important role of the KLRC3 gene.
A more recent study found decreased numbers of NK cell subsets (CD56bright and CD56dim) and an impaired function of NK cells in patients suffering from TIDM.18 There was a slightly decreased expression of NKG2D, an activating receptor belonging to the NKG2 family. The decreased expression was found in all patients with T1DM relative to control subjects, independent of the duration of disease.
The incidence of T1DM peaks in puberty.1,2 However, we did not find any positive correlation between KLRC3 expression and older age approaching puberty.
In our study, the most prevalent symptom in the diabetes groups was polyuria. A previous report found that polydipsia was the most prevalent symptom in their cases;19 however, patients with T1DM usually have both symptoms at presentation.
HbA1c was lower in patients with DKA at presentation. Although their fasting blood sugar was higher, this low HbA1c could be explained by their shorter duration of the disease compared to patients who presented with classical symptoms. However, we did not recognize any correlation between KLRC3 expression and HbA1c.
C-peptide was significantly lower in patients with DKA at presentation. C-peptide measurement assesses beta cell reserve and, hence, endogenous insulin secretion.20 This lower level of C-peptide indicates the more acute onset of the disease. However, there was no correlation between KLRC3 expression and C-peptide.
Serum pancreatic amylase was not affected in either diabetic group reflecting a normal exocrine pancreatic function. Previous studies19,20 have reported higher levels of serum pancreatic amylase in patients presenting with DKA. This result can be explained by temporary exocrine dysfunction, which resolved after insulin treatment and/or lymphocytic infiltration of the exocrine pancreas.
Our study was limited by its single-center design and small patient number.
Conclusion
The KLRC3 gene was downregulated in patients with T1DM. Greater downregulation was observed in patients with DKA compared to those who presented with classical symptoms. Expression of KLRC3 in T1DM might play a role in the pathogenesis of T1DM and be a predictor of its severity.
Disclosure
The authors declared no conflicts of interest. No funding was received for this study.
references
- Kerner W, Brückel J; German Diabetes Association. Definition, classification and diagnosis of diabetes mellitus. Exp Clin Endocrinol Diabetes 2014 Jul;122(7):384-386.
- American Diabetes Association. Diagnosis and classification of diabetes mellitus. Diabetes Care 2012 Jan;35(Suppl 1):S64-S71.
- Wild S, Roglic G, Sicree R, Green A, King HE. Global burden of diabetes mellitus in the year 2000. Epidemiology and Burden of Disease. Geneva: WHO; 2006.
- Alberti KG, Zimmet PZ. Definition, diagnosis and classification of diabetes mellitus and its complications. Part 1: diagnosis and classification of diabetes mellitus provisional report of a WHO consultation 1998; 15(7):539-553.
- Eizirik DL, Colli ML, Ortis F. The role of inflammation in insulitis and β-cell loss in type 1 diabetes. Nat Rev Endocrinol 2009 Apr;5(4):219-226.
- Majeed AA, Hassan K. Risk Factors for Type 1 Diabetes mellitus among children and adolescents in Basrah. Oman Med J 2011; 26(3):189-195.
- Neyestani TR, Djalali M, Pezeshki M, Siassi F, Eshraghian MR, Rajab A, et al. Serum antibodies to the major proteins found in cow’s milk of Iranian patients with Type 1 diabetes mellitus. Diabetes Nutr Metab 2004 Apr;17(2):76-83.
- Atkinson MA. The pathogenesis and natural history of type 1 diabetes. Cold Spring Harb Perspect Med 2012 Nov;2(11):a007641.
- Rodacki M, Svoren B, Butty V, Besse W, Laffel L, Benoist C, et al. Altered natural killer cells in type 1 diabetic patients. Diabetes 2007 Jan;56(1):177-185.
- Nakata S, Imagawa A, Miyata Y, Yoshikawa A, Kozawa J, Okita K, et al. Low gene expression levels of activating receptors of natural killer cells (NKG2E and CD94) in patients with fulminant type 1 diabetes. Immunol Lett 2013 Nov-Dec;156(1-2):149-155.
- 11. Yossef R, Gur C, Shemesh A, Guttman O, Hadad U, Nedvetzki S, et al. Targeting natural killer cell reactivity by employing antibody to NKp46: implications for type 1 diabetes. PLoS One 2015 Feb 26;10(2):e0118936.
- 12. Rodacki M, Milech A, de Oliveira JE. NK cells and type 1 diabetes. Clin Dev Immunol 2006 Jun-Dec;13(2-4):101-107.
- 13. Johansson S, Berg L, Hall H, Höglund P. NK cells: elusive players in autoimmunity. Trends Immunol 2005 Nov;26(11):613-618.
- 14. Mandal A, Viswanathan C. Natural killer cells: In health and disease. Hematol Oncol Stem Cell Ther 2015 Jun;8(2):47-55.
- 15. QIAGEN Co. miRNeasy Mini Handbook. Germany: QIAGEN;2013.
- 16. QIAGEN Co. QuantiTect Reverse Transcription Handbook. Germany: QIAGEN;2009.
- 17. QIAGEN Co. QuantiTect® SYBR® Green PCR Handbook. Germany: QIAGEN;2011.
- 18. Wang Z, Zheng C, Tan YY, Li YJ, Yang L, Huang G, et al. Gene expression changes in patients with fulminant type 1 diabetes. Chin Med J (Engl) 2011 Nov;124(22):3613-3617.
- 19. Hanafusa T, Imagawa A. Fulminant type 1 diabetes: a novel clinical entity requiring special attention by all medical practitioners. Nat Clin Pract Endocrinol Metab 2007 Jan;3(1):36-45.
- 20. Imagawa A, Hanafusa T, Miyagawa J, Matsuzawa Y. A novel subtype of type 1 diabetes mellitus characterized by a rapid onset and an absence of diabetes-related antibodies. Osaka IDDM Study Group. N Engl J Med 2000 Feb; 342(5): 301-307.