|
Introduction
Systemic Lupus Erythematosus (SLE) prototype of autoimmune disorders, is a chronic, usually life-long, potentially fatal, characterized by unpredictable exacerbations and remissions with protean clinical manifestations. The origin of autoantibody production in SLE is unclear, but a role has been suggested for an antigen driven process, spontaneous B-cell hyper-responsiveness, or impaired immune regulation. Thus, the etiology of SLE remains unknown and warrants in-depth investigation for the management of the disease. Evidence exists for the involvement of mycobacterial protein antigens in the autoantibody induction in SLE.1 Tumor necrosis factor-α (TNF-α) exerting its effects through its receptors namely, TNFR-I and TNFR-II is a central mediator of inflammation, immunity and autoimmunity, and it plays a crucial role in host defense.
Inhibition of TNF-α clearly predisposes to certain infections, such as granulomatous infections like tuberculosis (TB).2,3 Inhibition of TNF-α may result in the development of lupus-like syndrome.4,5 Furthermore, cases of TB have been reported in patients treated with TNF-α-antagonists. The risk of TB in SLE patients is associated with multiple other factors including age, country of origin or current residence, exposure history to persons with TB, concomitant therapy with other immunomodulators including corticosteroids, and disease activity. It is to be pointed out that the role of TNF-α in patients with osteoarthritis, which is an important form of arthritis as well as novel therapeutic strategies for the management of osteoarthritis has been well documented.6,7
An attempt will be made to see the possible involvement of Mycobacterial protein antigen(s) acting as an alternate autoantigen for autoimmune disorders by employing various techniques such as SDS-PAGE, direct binding and competition ELISA. Thus, it is hoped that the present study would help garner better understanding of the contributory role of Mycobacterium tuberculosis (MTB) infection in the morbidity and mortality of patients with SLE, especially in areas in which this bacteria is endemic.
Methods
Sera samples were obtained from different TB patients having sputum or PCR positivity or X-Ray suggestive of TB; and SLE patients who met at least four or more of the 1997 Revised American college rheumatology (ACR) criteria for lupus were enrolled in the study. None of the subjects had sepsis, known malignancy, pregnancy, drug intake (steroids, cyclophosphamide, anti-tubercular treatment, etc) at the time of entry to the study. Controls were age and sex matched to lupus, TB patients and met the same exclusion criteria. This study was done on 100 patients divided into SLE group (n=30), TB group (n=30), SLE-TB group (n=30) and control group (n=10). Normal human sera were obtained from healthy subjects. TB, SLE and TB-SLE sera were obtained from patients at the Department of Biochemistry, J. N. Medical College, Aligarh from the year 2006 to 2009. The study was approved by the local ethics committee, and all patients gave informed consent prior to study entry. Serum and whole blood were obtained from the same patients. Serum samples were decomplemented by heating at 56°C for 30 minutes and stored in small aliquots at -20°C until use with 0.1% sodium azide as a preservative.
Bovine serum albumin, Calf thymus DNA, Coomassie Brilliant Blue R 250, agarose, ethidium bromide and anti-human IgG alkaline phosphatase conjugate were purchased from Sigma Chemical Company, U.S.A. Acrylamide, bis-acrylamide, N-N-N' -N' tetramethyl ethylenediamine, ammonium persulphate and Tween-20 were obtained from Bio-Rad Laboratories, U.S.A.
Preparation of Mycobacterium
Briefly, virulent laboratory-adapted Mycobacterium tuberculosis (H37Rv) were grown in Middlebrook 7H9 broth (HiMedia, India) supplemented with Middlebrook ADC enrichment fluid (HiMedia) or modified Souton medium at 37°C in 5% CO2. Midlogarithmic mycobacterial cultures (14 days) were harvested and sonic extract, as well as culture supernatant proteins were separated on 5-20% gradient SDS-PAGE and 30 kDa protein was electroeluted.
PBMC Preparation
For isolation of peripheral blood mononuclear cells (PBMC), blood was collected from normal humans, TB patients, SLE patients and TB-SLE patients by venipuncture in heparinized syringes. Fifteen ml heparinized blood were diluted 1:1 with PBS (phosphate buffer saline; 10 mM; pH 7.4) and layered over a 15 ml Ficoll paque cushion (Pharmacia Fine Chemicals, Sweden). After centrifugation at 950g for 15 minutes, the interface containing PBMC was collected and washed two times with PBS. This preparation contained approximately 10% monocytes and 90% lymphocytes. Cell pellets containing PBMC were suspended in Roswell Park Memorial Institute (RPMI-1640) containing glutamine and HEPES (HiMedia, India), without antibiotics (complete medium), and kept on ice. An aliquot was diluted 20-fold and cells were counted using a hemocytometer. The mean purity of the monocyte isolations ranged from 87.9 to 96.4%, as assessed by flow cytometric analysis. The isolated cells were more than 95% viable and were not activated.
Cell culture
PBMC (5×10⁶ cells/well) were added in 12-well tissue culture plates (Costar Corp., Cambridge, MA) in complete Roswell Park Memorial Institute (RPMI-1640) medium, and were subsequently incubated at 37°C, 5% CO2 for 1-2 hours for adherence. Thereafter, non-adherent cells were removed by washing the plates four times with RPMI medium. Then, the adherent monocytes were cultured in RPMI supplemented with 2% serum, followed by overnight resting at 37°C, 5% CO2. Cells harvested at this time point were considered as time zero (to). As per experimental design, some cultures received 10 nM reduced glutathione. Other cultures received RPMI-1640 medium with 2% autologous serum. Cultures were then harvested after 24 hours and cell protein lysates were prepared as described by Tasneem et al.1 Thereafter, the said lysates were transferred to tubes and vortexed for 10 minutes in the presence of glass beads/fine particles of glass to ensure complete liberation of intracellular proteins. Finally, the tubes were centrifuged at low speed to remove fine particles of glass and were employed as valuable inhibitors in ELISA. The supernatant of the cultures was aspirated and kept at -70°C.
The antibodies were detected and quantitated by Enzyme Linked-Immunosorbent Assay (ELISA) using polystyrene flat bottom microtiter plates (NUNC, Denmark) as solid phase. The method described by Tasneem S. et al.1 was followed for the assay. Polystyrene microtiter plates were incubated with 100 µl of protein antigen (50 µg/ml in carbonate/ bicarbonate buffer, pH 9.6) for two hours at room temperature, followed by overnight incubation at 4°C. The plates were washed thrice with TBS-T and the unoccupied sites were blocked by 150 µl of 1.5% BSA in TBS for six hours at room temperature. Varying dilutions of sera diluted in TBS were added to antigen coated as well as control wells. The antigen-antibody interaction was allowed to proceed for two hours at room temperature followed by overnight incubation at 4°C and subsequently, the plates were washed four times with TBS-T in order to remove the uninteracted antibodies. Bound antibodies were assayed with an appropriate anti-immunoglobulin alkaline phosphatase conjugate using p-nitrophenyl phosphate as substrate. The absorbance of each well was monitored at 410 nm on an ELISA microplate reader after proper color development. Each sample was coated in duplicate and the results were expressed as a mean of Atest - Acontrol.
For nucleic acid antigens, the polystyrene microtiter plates were preincubated with 100 µl of poly D-lysine solution (50 µg/ml in distilled water) for half an hour so as to increase antigen immobilization. The plates were washed thrice with TBS and coated with 100 µl of nucleic acid antigen(s) at a concentration of 2.5 µg/ml in TBS for two hours at room temperature, followed by overnight incubation at 4°C. After eliminating the unbound antigen by washing with TB-T (3 times), the unoccupied positively charged polylysine molecules were neutralized by saturating the plates with 100 µl of negatively charged poly L-glutamate (50 µg/ml in TBS) for two hours at room temperature. The rest of the steps were the same as described above.
The antigen binding specificity of antibody was determined by inhibition experiments.1 Varying concentrations of inhibitors (0-15 µg/ml) were mixed with a constant amount of antiserum. The mixture was incubated for two hours at 37°C followed by overnight incubation at 4°C. The resulting immune complex was coated onto the wells instead of serum. The rest of the steps were as in direct binding ELISA. The determination of protein concentration was estimated by the method of Lowry et al.8 with bovine serum albumin as the standard.
Polyacrylamide slab gel electrophoresis (Braun-Sonic, Melsunger, Germany) for proteins was performed under denaturing conditions as described.9 The reagents were mixed and poured into the gradient former and 20-5% gradient gel was formed from the bottom to top between two glass plates separated by 1 mm thick spacer. The gel was allowed to polymerize at room temperature. The samples were electrophoresed for 8-10 hrs at room temperature at 80 volts. The gel was stained by 0.2% Coomassie Brilliant Blue R 250 or with silver stain reagent.10
SPSS 16.0 software package program was employed for the statistical evaluation. Results were analyzed using one-way analysis of variance (ANOVA) and were expressed as Mean ± SD. A value of p<0.05 was considered statistically significant.
Results
Mean values of age, gender, SBP, DBP for patients and controls are recorded in Table 1. Data are expressed as Mean ± SD of the mean of 10 controls and 30 SLE patients, 30 TB patients and 30 SLE-TB patients. Clinical characteristics and laboratory investigations are summarized in Table 1, as percentages (%). Prior to any immunological investigation, all the TB and SLE sera’s (n=30 each) undertaken in this study were subjected to specificity determination against respective antigens and inhibitors i.e. tuberculosis 85B antigen (30kDa) for TB sera and dsDNA for SLE patients respectively, by employing competition-inhibition ELISA.
Table 1: Clinical characteristics of SLE group, TB group, SLE-TB group and control subjects.
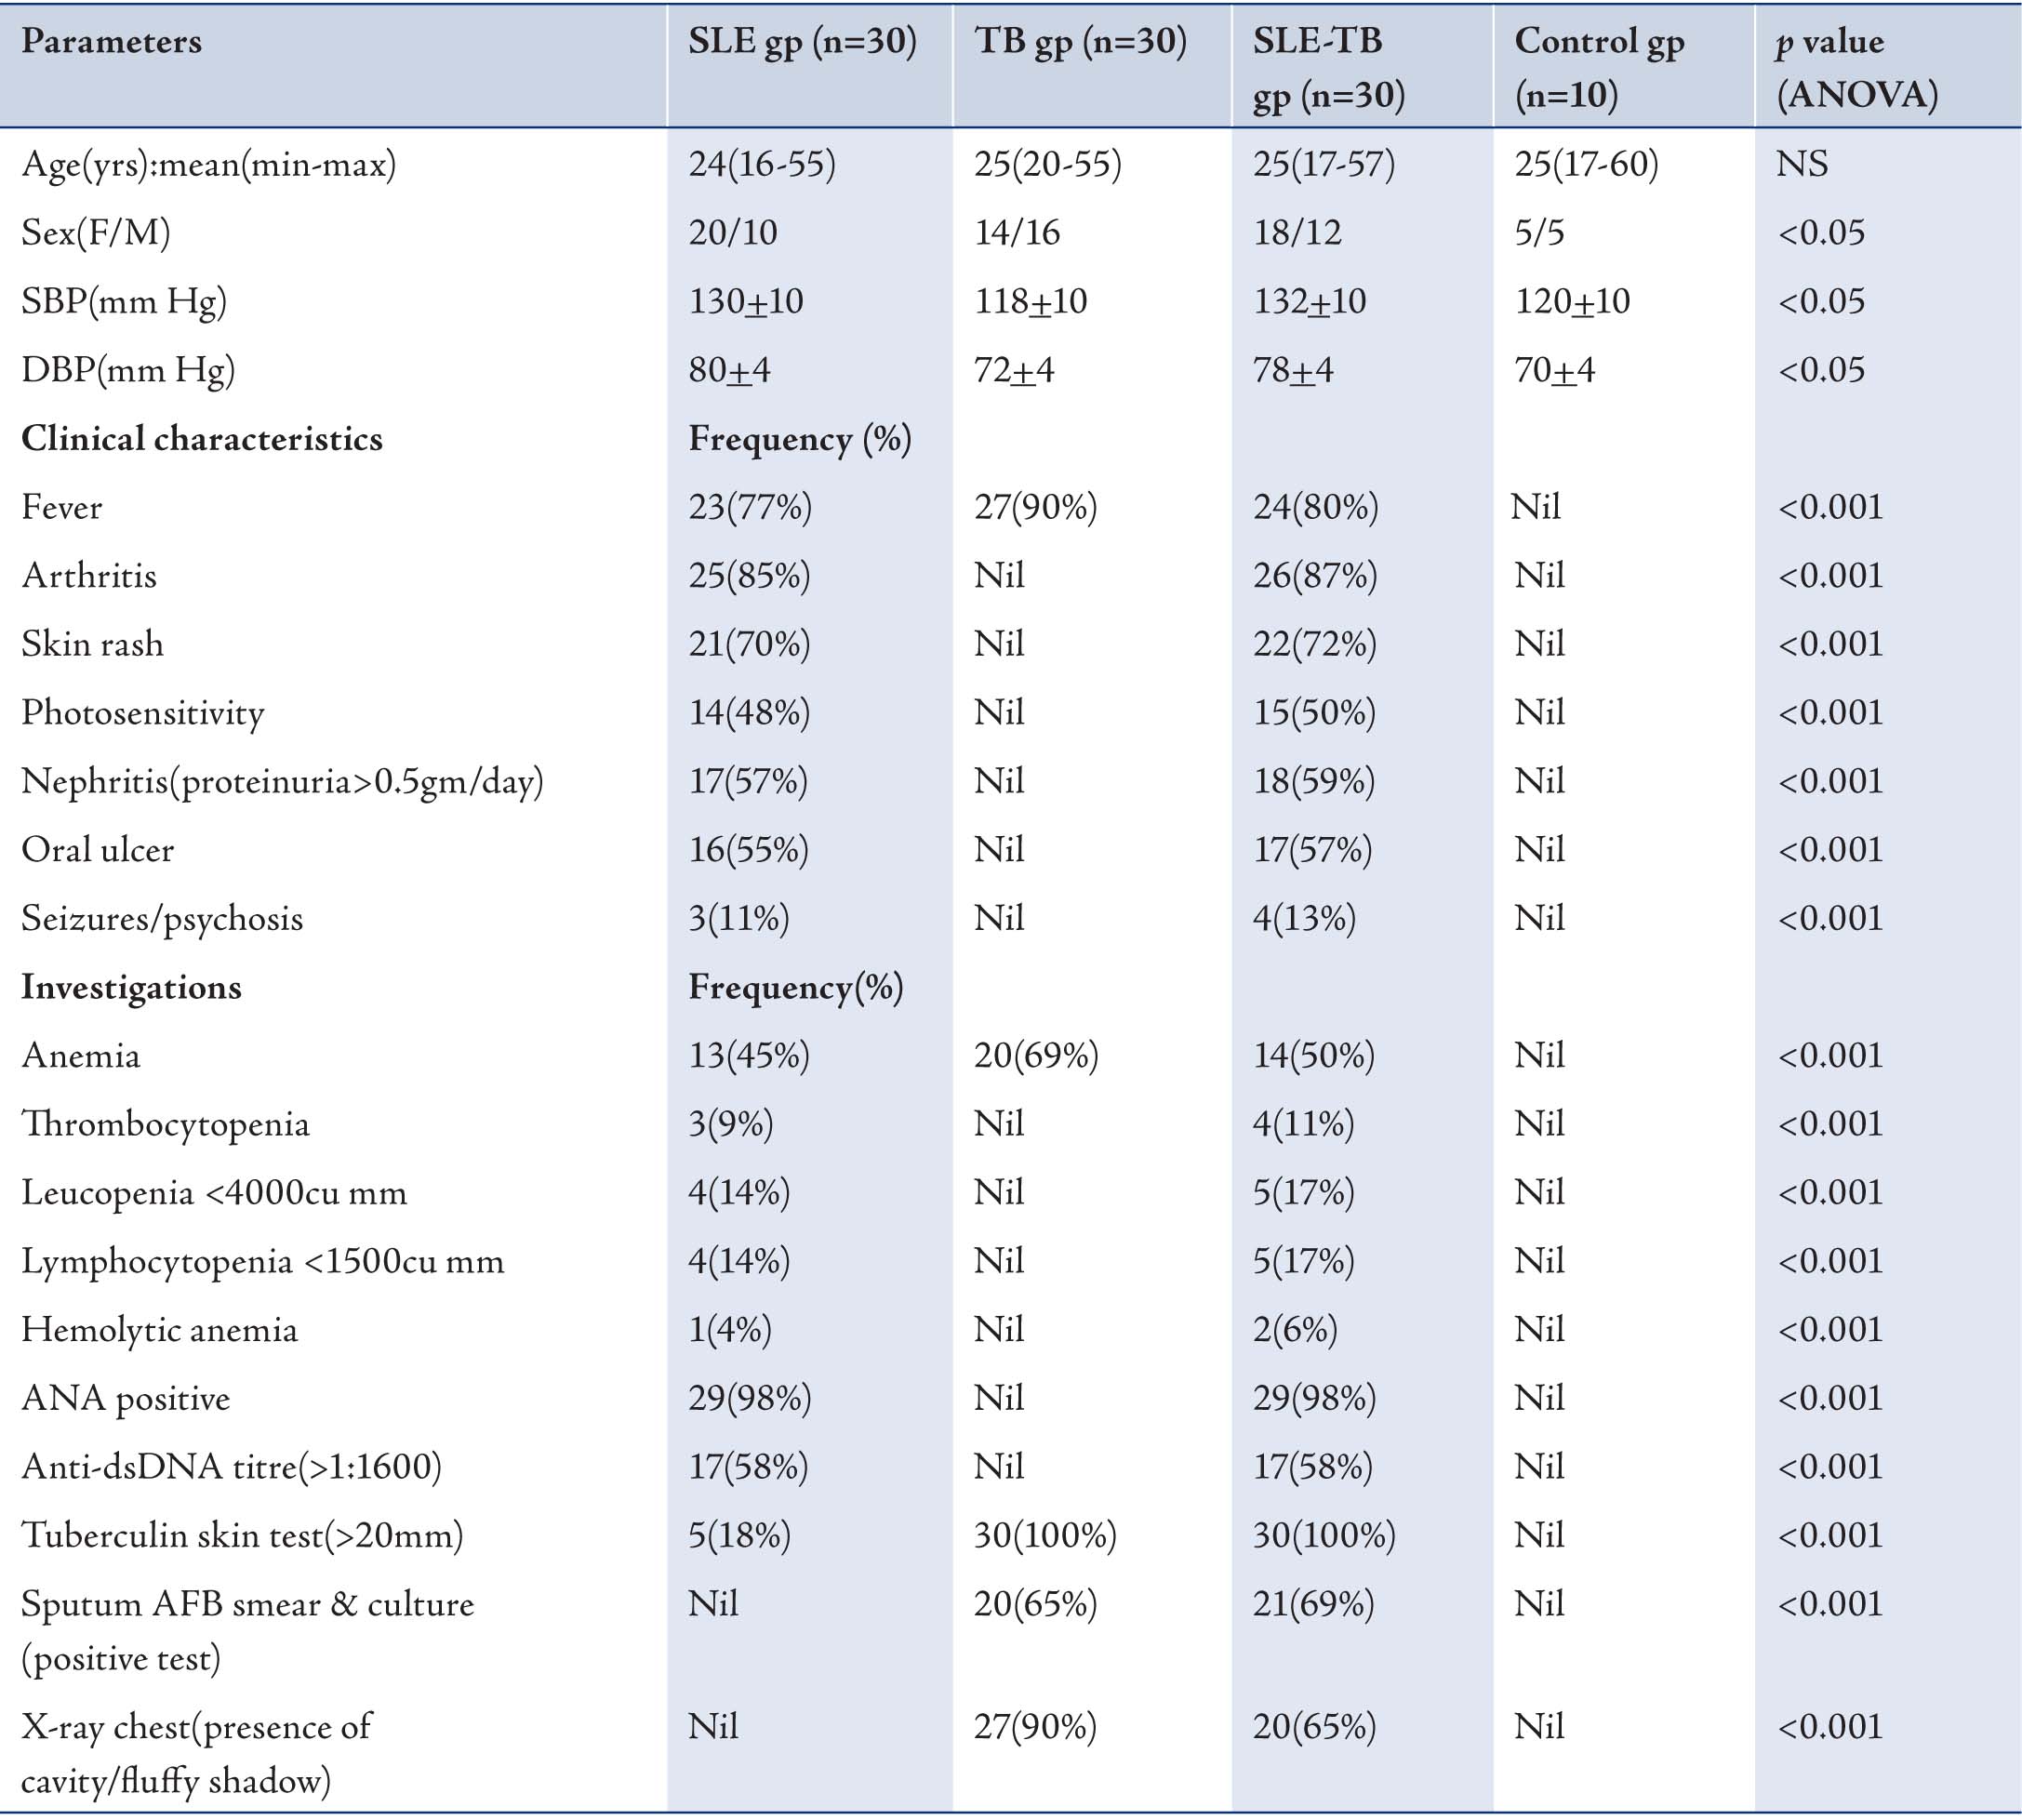
ÅNS: not significant; SBP: systolic blood pressure; DBP: diastolic blood pressure; n: frequency; AFB: acid fast bacilli; gp: group.
Inhibition ELISA on plates coated with mycobacterium tuberculosis 85B antigen (30kDa) against sera of patients (n=30) with TB indicated interesting results. It is to be pointed out that 10 patients were selected from each category for ELISA. Nearly all the TB sera (n=30) employed in this study exhibited a maximum of 84% inhibition in anti-TB antibody activity at a maximum inhibitor (i.e. MTB 30kDa) concentration of 10 ug/ml, (p<0.001; Fig. 1a). Fifty percent inhibition here was achieved at an inhibitor concentration of 0.1 ug/ml; thereby indicating the high specificity of TB antibodies in TB sera against MTB 30kDa.
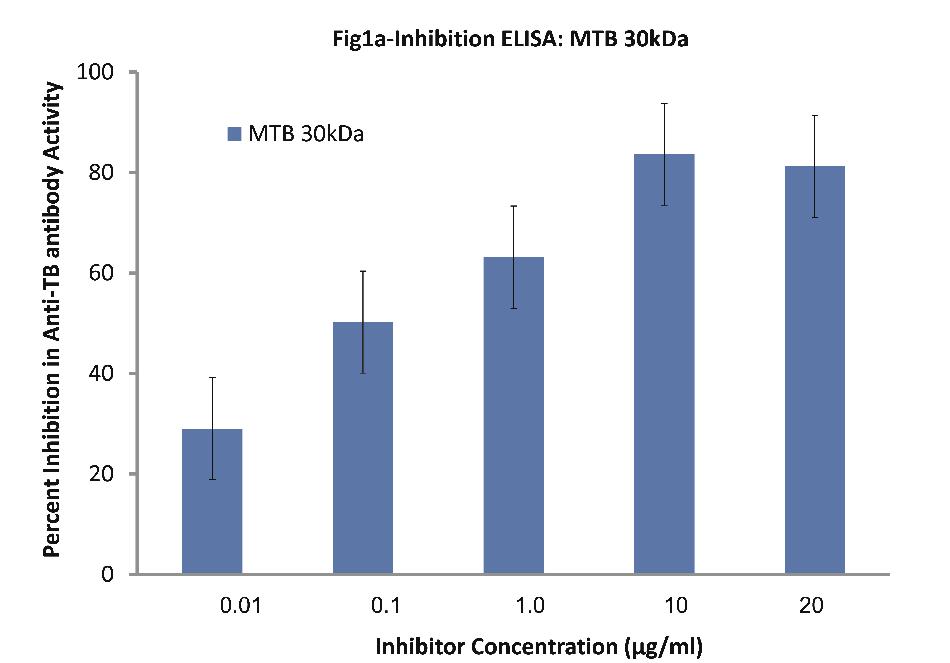
Figure 1a: Inhibition ELISA against antibodies in sera of patients with TB (n=30) on plates coated with 30 kDa Ag85B isolated from mid-logarithmic phase cultures of Mycobacterium tuberculosis H37Rv. The inhibitor used here was varying concentrations of 30 kDa Ag85B. The concentrations were 0.01, 0.1, 1.0, 10 and 20 µg/ml. Data are mean ±SD.
As evident from Fig.1b; all SLE sera (n=30) of patients exhibited a maximum of 89% inhibition in anti-dsDNA antibody activity at maximum inhibitor (i.e. dsDNA) concentration of 10 µg/ml, (p<0.001). Fifty percent inhibition in anti-DNA antibody activity was recorded at an inhibitor concentration of 0.08 ug/ml.
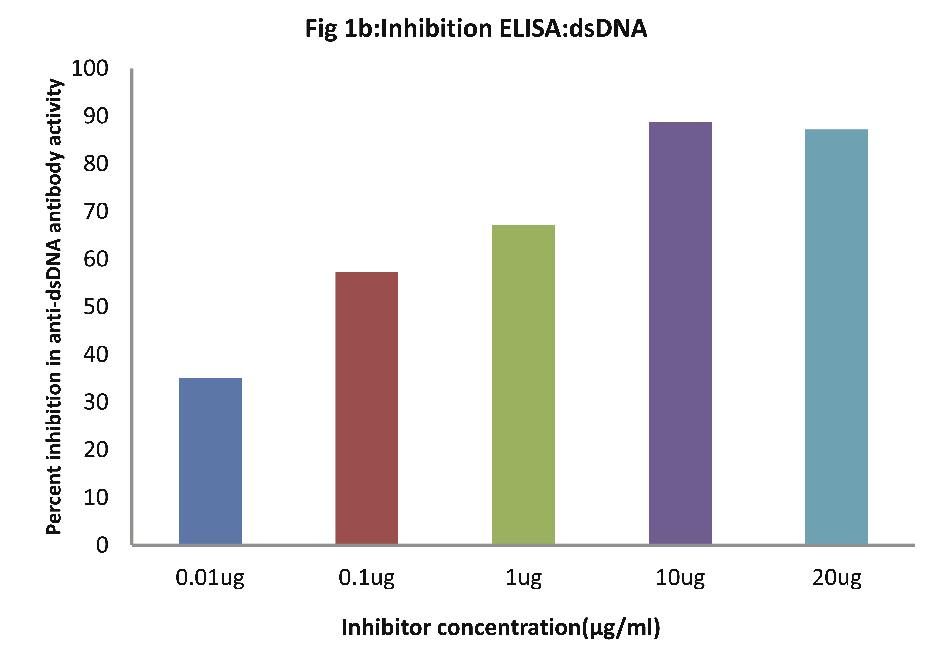
Figure 1b: Inhibition ELISA against antibodies in sera of patients with SLE (n=30) on plates coated with dsDNA. The inhibitor used here was varying concentrations of dsDNA. The concentrations were 0.01, 0.1, 1.0, 10 and 20 µg/ml. Data are mean ±SD.
After selecting high specificity sera’s of TB and SLE patients as shown above, an attempt was made to evaluate the correlation, if any, between TB and autoimmune SLE. For this purpose, we investigated: (a) the reactivity/specificity of anti-DNA antibodies found in SLE sera (n=20) against mycobacterial Ag85B (30 kDa) in comparison to dsDNA, (b) reactivity/specificity of anti-TB antibodies found in TB sera (n=20) against dsDNA in comparison to mycobacterial Ag85B (30 kDa), and (c) comparative reactivity of dsDNA versus MTB 30 kDa against sera from patients having both TB and SLE (n=20).
As evident in Fig. 2a; sera of SLE patients (n=20) exhibited a maximum of 87% inhibition (p<0.001) in anti-dsDNA antibody activity on microtiter ELISA plates coated with dsDNA, with inhibitor as dsDNA at a concentration of 10 µg/ml, where 50% inhibition in anti-DNA antibody activity was recorded at an inhibitor concentration of 0.08 µg/ml. Interestingly, when MTB 30kDa was employed as an inhibitor on plates coated with dsDNA, then a magnitude of binding was observed with anti-DNA Abs found in SLE sera. A maximum of 78.2% inhibition (p<0.001) in anti-DNA activity was recorded by 10 ug/ml of mycobacterial 30kDa antigen/inhibitor, where 50% inhibition was achieved at an inhibitor concentration of 0.09 ug/ml. This inhibition ELISA results showed that SLE sera had reactivity for both dsDNA and MTB antigens.
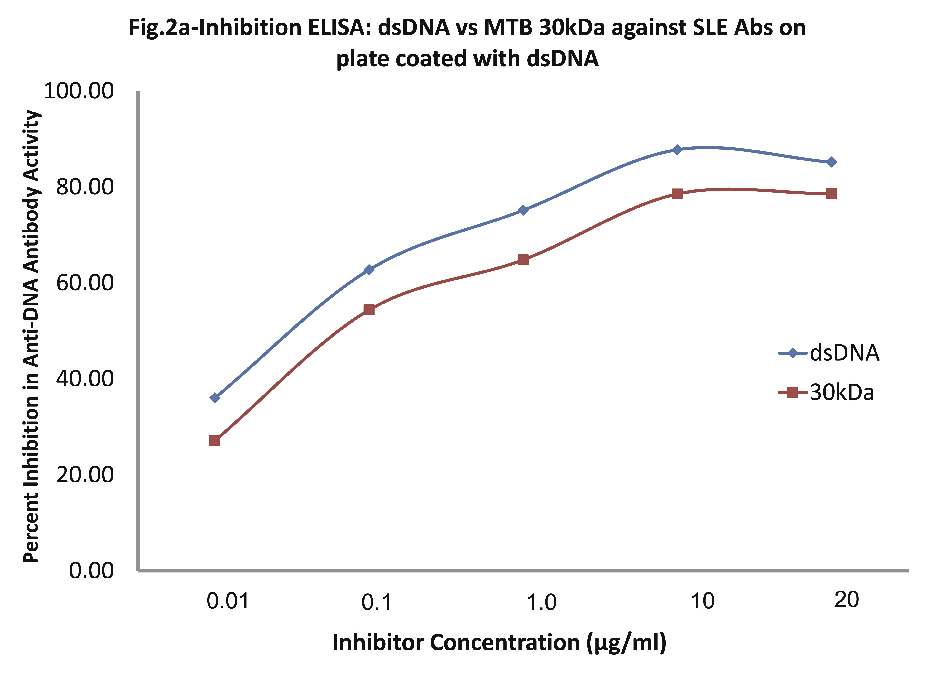
Figure 2a: Comparative Inhibition ELISA against autoantibodies in patients with SLE (n=30) on plates coated with native dsDNA (non-mycobacterial), where the inhibitors used were varying concentrations of native dsDNA versus mycobacterial 30 kDa Ag85B. The concentrations for both the inhibitors were 0.01, 0.1, 1.0, 10 and 20 µg/ml. dsDNA (-ν-) and mycobacterial 30 kDa Ag85B (-π-). Data are mean ±SD.
As evident in Fig. 2b; sera of TB patients (n=20) exhibited a maximum of 83.50% inhibition (p<0.001) in anti-TB antibody activity on microtiter ELISA plates coated with MTB30kDa with inhibitor as MTB30kDa at a concentration of 10 µg/ml, where 50% inhibition in anti-TB antibody activity was recorded at an inhibitor concentration of 0.09 µg/ml. Interestingly, when dsDNA was employed as an inhibitor on plates coated with MTB30kDa, then a maximum of 24.24% inhibition in anti-TB activity was recorded at a concentration of 10 ug/ml, (p>0.05). This inhibition ELISA result showed that TB sera had reactivity for MTB antigen but not for dsDNA antigen.
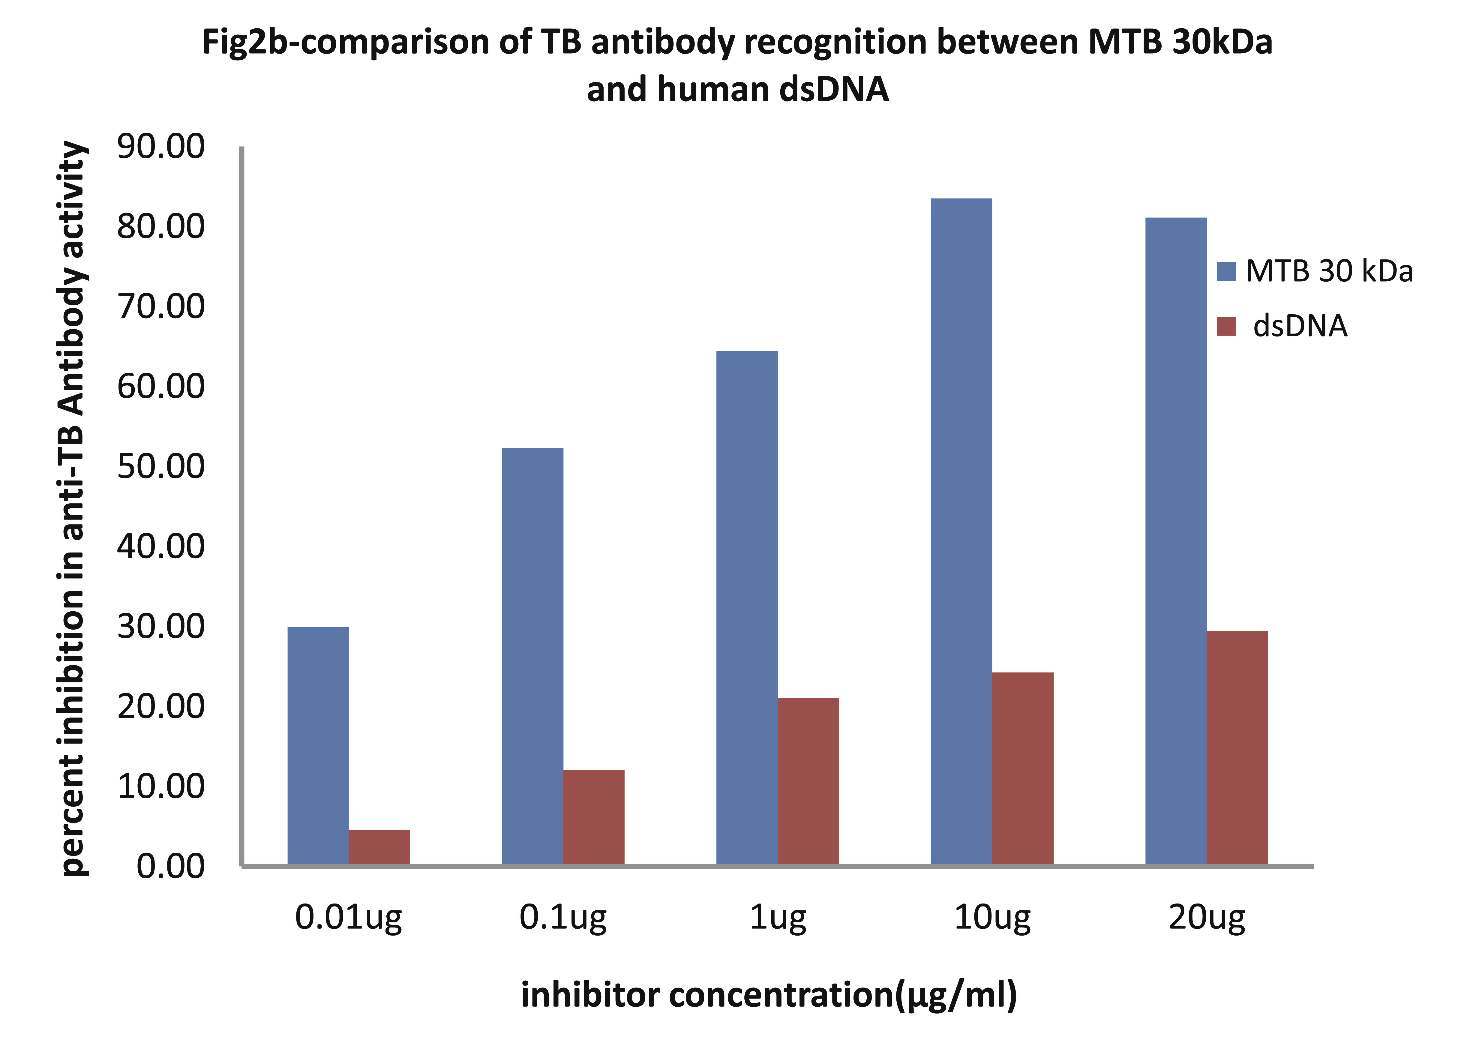
Figure 2b: Comparative Inhibition ELISA against autoantibodies in patients with TB (n=30) on plates coated with MTB 30kDa, where the inhibitors used were varying concentrations of native dsDNA versus mycobacterial 30 kDa Ag85B. The concentrations for both the inhibitors were 0.01, 0.1, 1.0, 10 and 20 µg/ml. Data are mean ±SD.
As evident in Fig. 2c; the sera of SLE-TB patients (n=20) exhibited a maximum of 83.61% inhibition in antibody activity in SLE-TB sera on microtiter ELISA plates coated with MTB30kDa antigen with inhibitor as dsDNA at a concentration of 10µg/ml, where 50% inhibition in anti-DNA antibody activity was recorded at an inhibitor concentration of 0.08 µg/ml, (p<0.001). Interestingly, when MTB30kDa was employed as an inhibitor on plates coated with MTB30kDa, then a maximum of 79.73% inhibition (p<0.001) in antibody activity in SLE-TB sera was recorded by 10 ug/ml of mycobacterial 30kDa inhibitor, where 50% inhibition was achieved at an inhibitor concentration of 0.09 ug/ml. This inhibition ELISA result showed that SLE-TB sera had reactivity for both dsDNA antigen and MTB antigen.
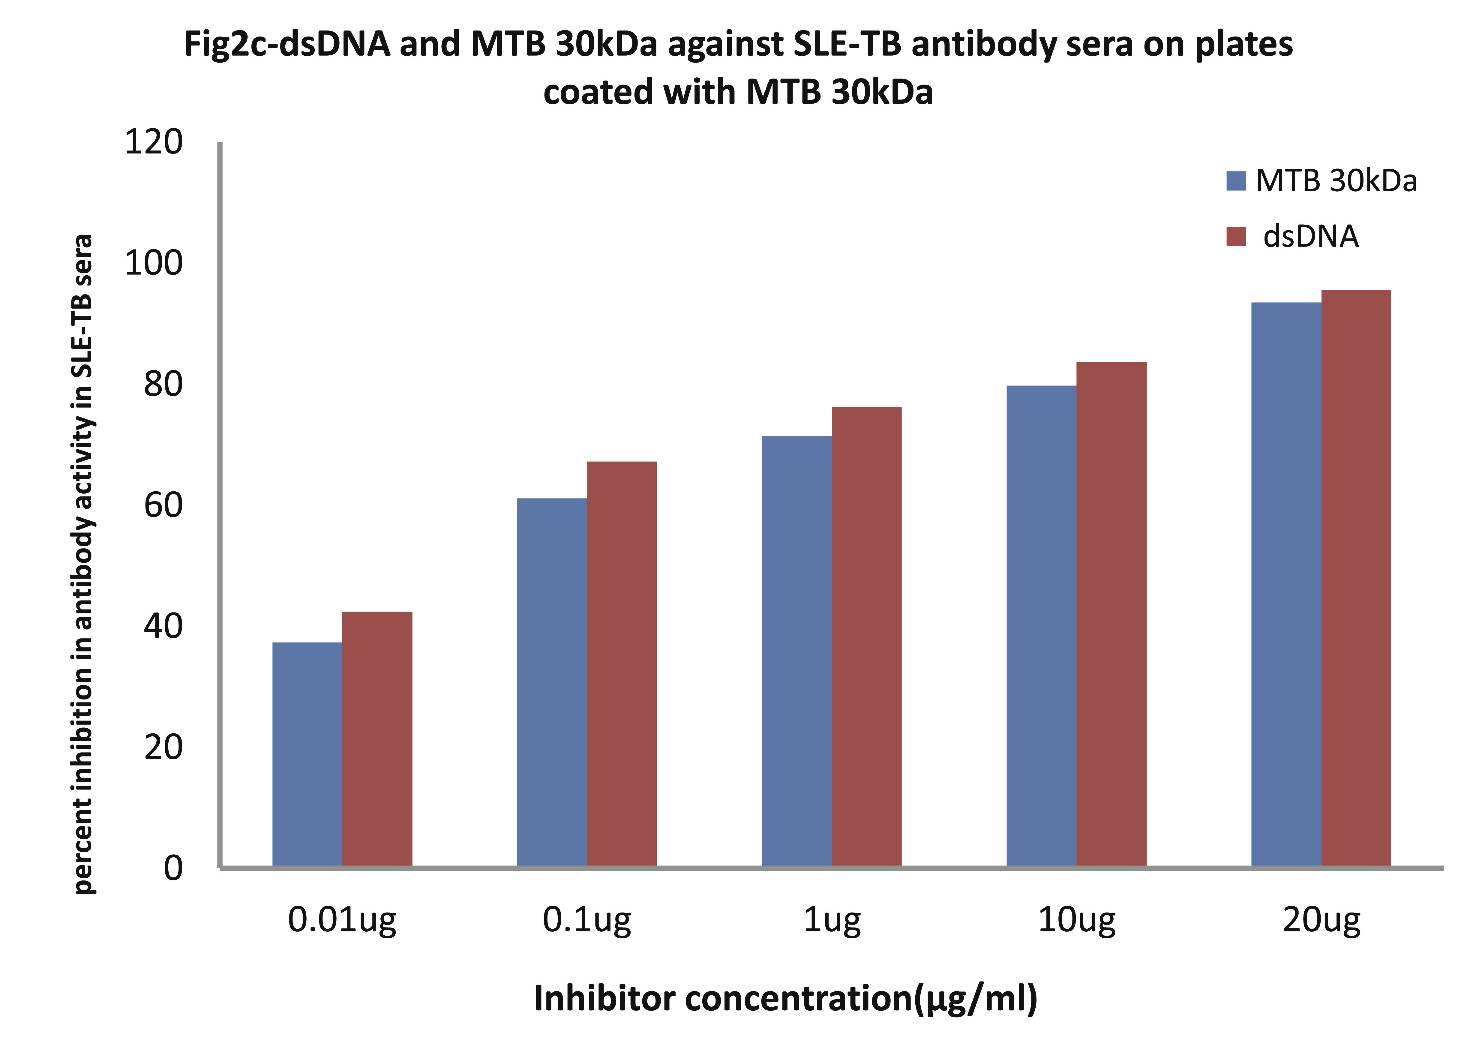
Figure 2c: Comparative Inhibition ELISA against autoantibodies in patients with SLE-TB (n=30) on plates coated with MTB 30kDa, where the inhibitors used were varying concentrations of native dsDNA versus mycobacterial 30 kDa Ag85B. The concentrations for both the inhibitors were 0.01, 0.1, 1.0, 10 and 20 µg/ml. Data are mean ±SD.
As evident from Fig. 3 (n=30); the level of secreted TNF-α in culture supernatants was found to be greatest in cultures of monocytes from patients in the TB-SLE group, followed by cultures of monocytes of SLE and TB patients respectively, (p<0.001 for all; Fig. 3). The order (percent reduction) of reduced glutathione-induced suppression in secreted TNF-α in monocyte culture supernatants was TB > SLE > TB-SLE, (p<0.001; Fig. 3). It is noteworthy to observe that secreted TNF-α was highest in culture supernatants of patients belonging to category III (Age: 51-65 yrs), followed by category II (Age: 36-50 yrs) and category I (Age: 20-35 yrs), respectively.
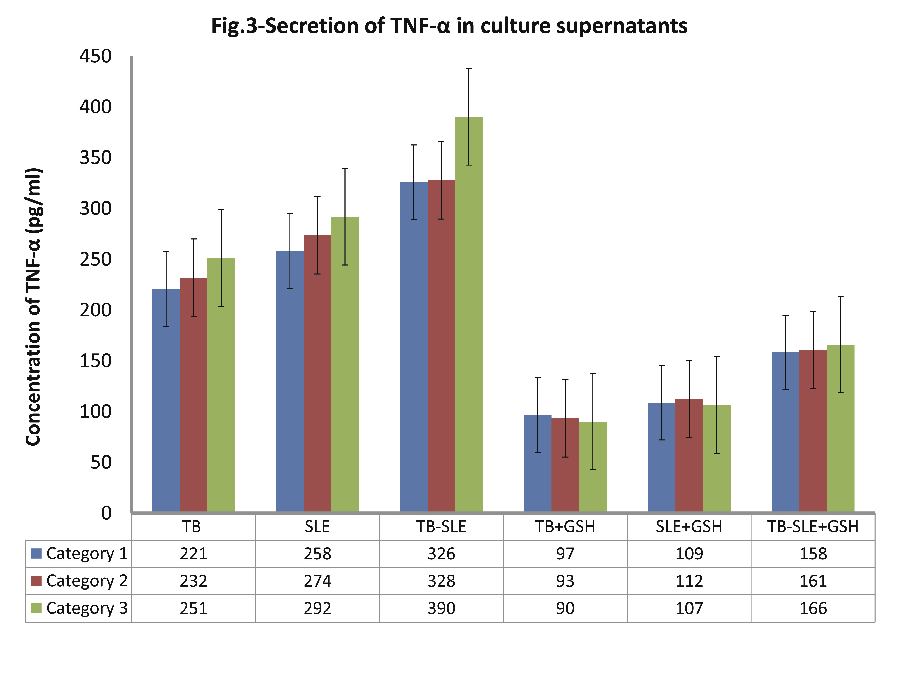
Figure 3: Expression of secreted pro-inflammatory cytokine TNF-α in supernatants of monocytes that were cultured for 24 hrs with and without 10 nM of reduced glutathione.
An attempt was also made to evaluate the immuno-binding by employing in-vivo conditions i.e. by using cultured monocytes that were infected with bacilli (M. tuberculosis patients) as well as monocytes from SLE patients. The high percent maximum inhibitions as well as 50% inhibitions in anti-tuberculosis and anti-DNA activities at extremely low inhibitor concentrations are suggestive for the appreciably high affinity immuno-interaction occurring between anti-tuberculosis antibodies and anti-DNA autoantibodies with antigens in monocyte protein lysates of M. tuberculosis patients and SLE patients, respectively.
As evident in Fig. 4a; TB patients sera (n=5) exhibited a maximum 91.83% inhibition (p<0.001), in antibody activity, where the inhibitor used were antigens in monocytes protein lysates of MTB patients, at a concentration of 10 µg/ml and 50% inhibition in antibody activity at a concentration less than 0.08 µg/ml.
Also, as Fig. 4b demonstrates; SLE patients sera (n=5) exhibited a maximum 95.87% (p<0.001) inhibition in antibody activity, where the inhibitor used were antigens in monocytes protein lysates of SLE patients, at a concentration of 10 µg/ml and 50% inhibition in antibody activity at a concentration less than 0.07 µg/ml.
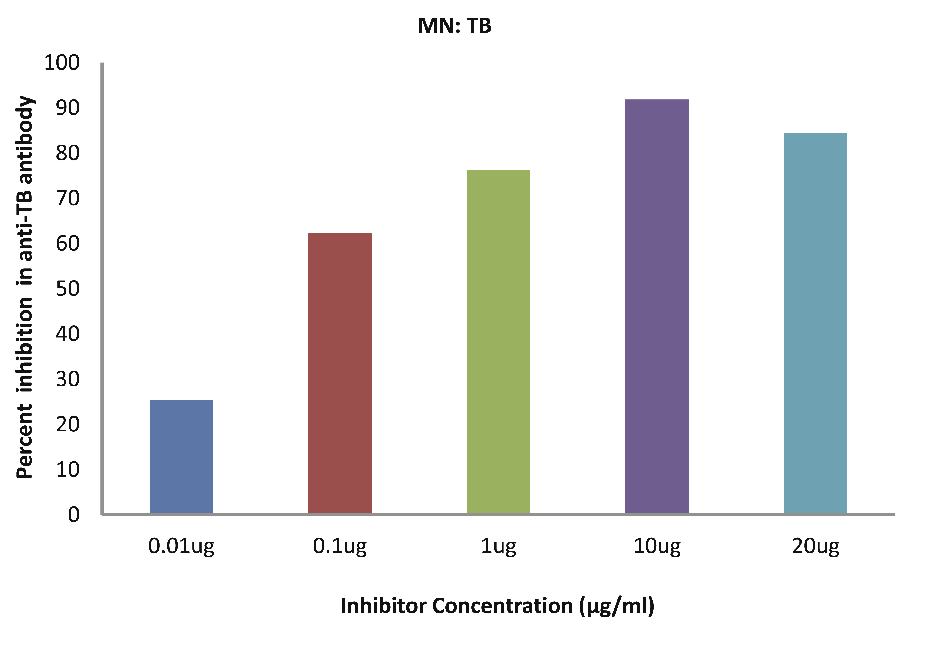
Figure 4a: TB patients sera (n=5) exhibited a maximum 91.83% (p<0.001) inhibition in antibody activity where the inhibitor used were antigens in monocytes protein lysates of MTB patients, at a concentration of 10 µg/ml and 50% inhibition in antibody activity at a concentration less than 0.08 µg/ml. The concentrations for inhibitors were 0.01, 0.1, 1.0, 10 and 20 µg/ml. Data are mean ±SD.
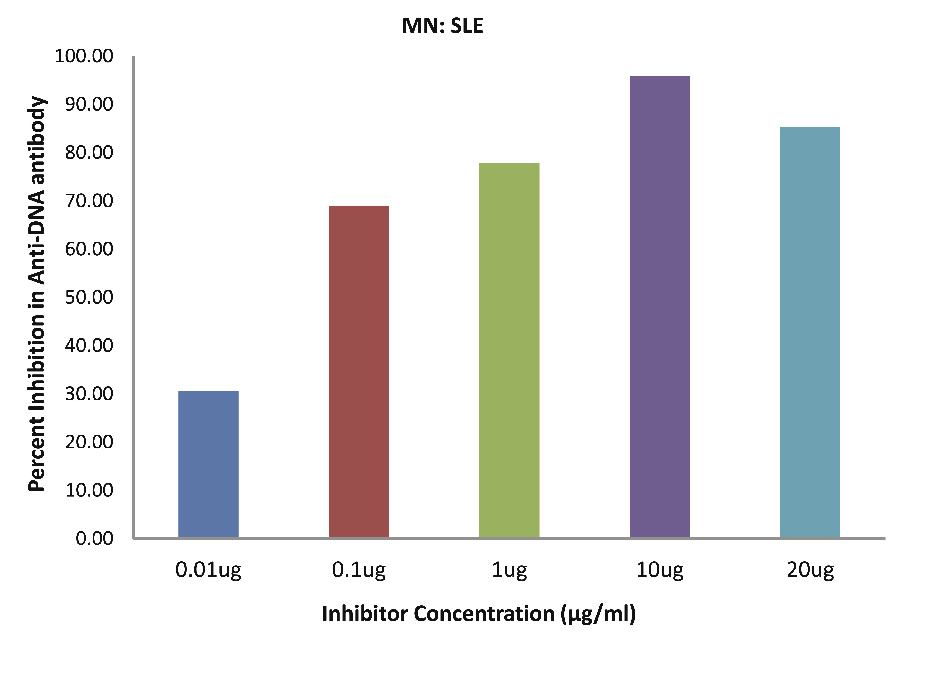
Figure 4b: SLE patients sera (n=5) exhibited a maximum 95.87% (p<0.001) inhibition in antibody activity where the inhibitor used were antigens in monocytes protein lysates of SLE patients, at a concentration of 10 µg/ml and 50% inhibition in antibody activity at a concentration less than 0.07 µg/ml. The concentrations for inhibitors were 0.01, 0.1, 1.0, 10 and 20 µg/ml. Data are mean ±SD.
As evident in Fig. 4c; SLE-TB patients sera (n=5) exhibited a maximum 85.02% inhibition in antibody activity (p<0.001), where the inhibitor used were antigens in monocytes protein lysates of SLE-TB patients at a concentration of 10 µg/ml and 50% inhibition in antibody activity at a concentration less than 0.01 µg/ml.
The most striking finding in the present study is the reduced glutathione-induced down-regulation in binding of anti-TB antibodies and anti-DNA antibodies with antigens present in protein lysates prepared from monocyte of M. tuberculosis patients and SLE patients, respectively. Similar actions of reduced glutathione in monocytes obtained from the blood of patients having both M. tuberculosis along with SLE further substantiates the antioxidant-induced suppression in immuno-binding. Furthermore, these results are correlating appreciably with the amount of TNF-α secreted in different monocyte cultures undertaken in this study.
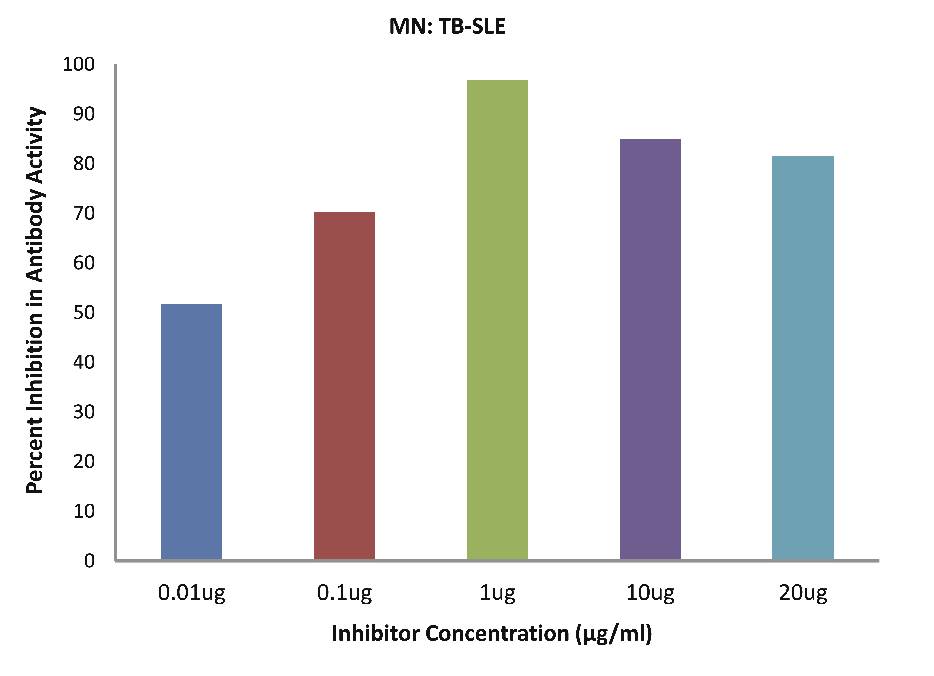
Figure 4c: SLE-TB patients sera (n=5) exhibited a maximum 85.02% (p<0.001) inhibition in antibody activity where the inhibitor used were antigens in monocytes protein lysates of SLE-TB patients, at a concentration of 10 µg/ml and 50% inhibition in antibody activity at a concentration less than 0.01 µg/ml. The concentrations for inhibitors were 0.01, 0.1, 1.0, 10 and 20 µg/ml. Data are mean ±SD.
As evident in Fig. 4d; after the addition of reduced glutathione, TB patients sera (n=5) exhibited a maximum of 32.90% inhibition in antibody activity (p>0.05), where the inhibitor used were antigens in monocytes protein lysates of TB patients, at a concentration of 10 µg/ml. While as illustrated in Fig. 4e; after the addition of reduced glutathione, SLE patients sera (n=5) exhibited a maximum of 33.58% inhibition in antibody activity (p>0.05), where the inhibitor used were antigens in monocytes protein lysates of SLE patients, at a concentration of 10 µg/ml.
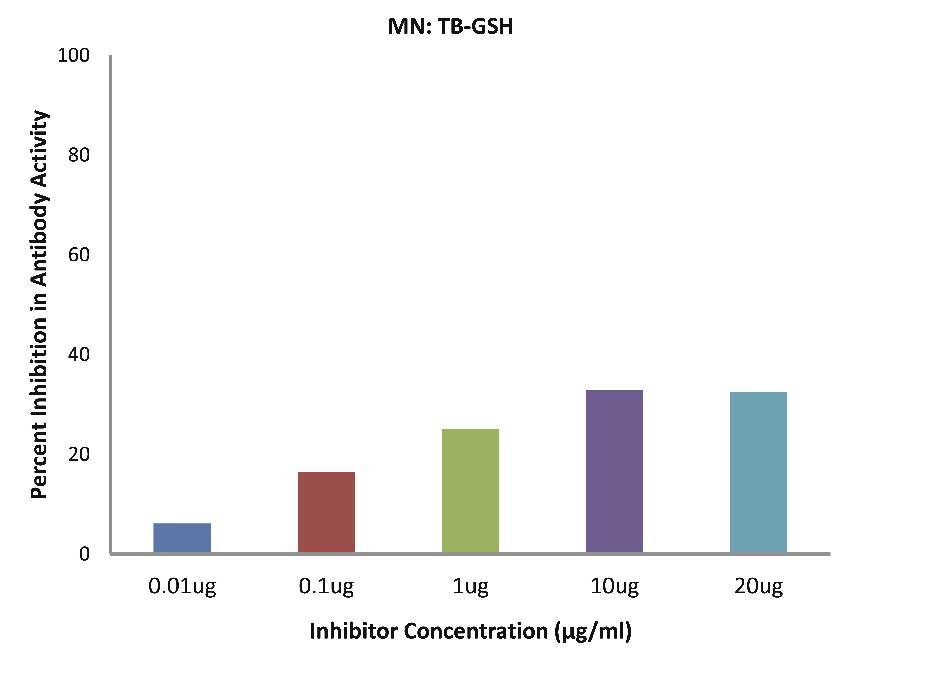
Figure 4d: After the addition of reduced glutathione, TB patients’ sera (n=5) exhibited a maximum 32.90% (p>0.05) inhibition in antibody activity where the inhibitor used were antigens in monocytes protein lysates of TB patients, at a concentration of 10 µg/ml. The concentrations for inhibitors were 0.01, 0.1, 1.0, 10 and 20 µg/ml. Data are mean ±SD.
As evident in Fig. 4f; after the addition of reduced glutathione, SLE-TB patients sera (n=5) exhibited a maximum of 38.08% inhibition in antibody activity (p>0.05), where the inhibitor used were antigens in monocytes protein lysates of SLE-TB patients, at a concentration of 10 µg/ml.
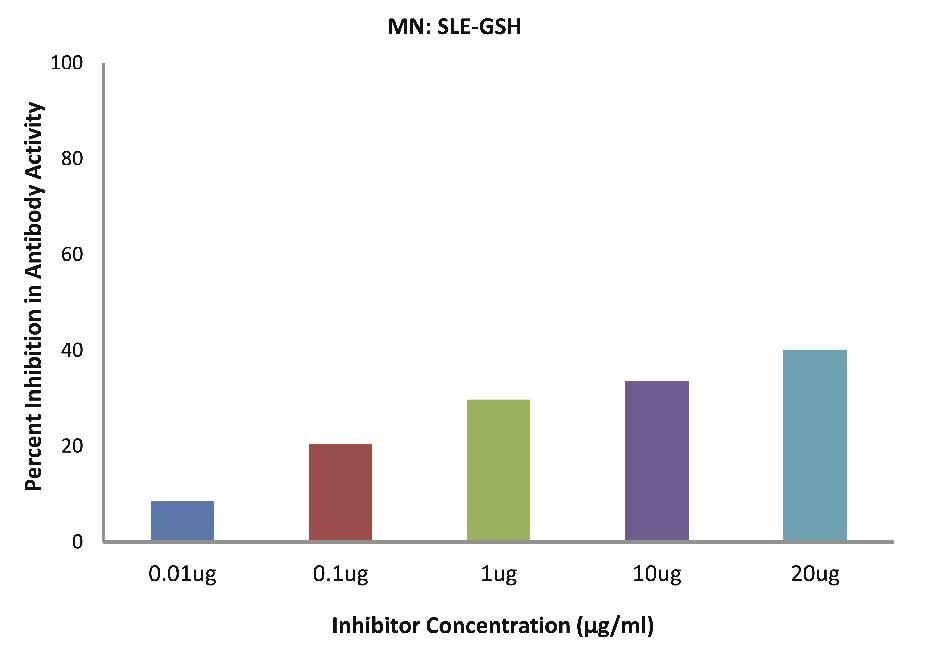
Figure 4e: After the addition of reduced glutathione, SLE patients sera (n=5) exhibited a maximum 33.58% (p>0.05) inhibition in antibody activity where the inhibitor used were antigens in monocytes protein lysates of SLE patients, at a concentration of 10µg/ml. The concentrations for inhibitors were 0.01, 0.1, 1.0, 10 and 20 µg/ml. Data are mean ±SD.
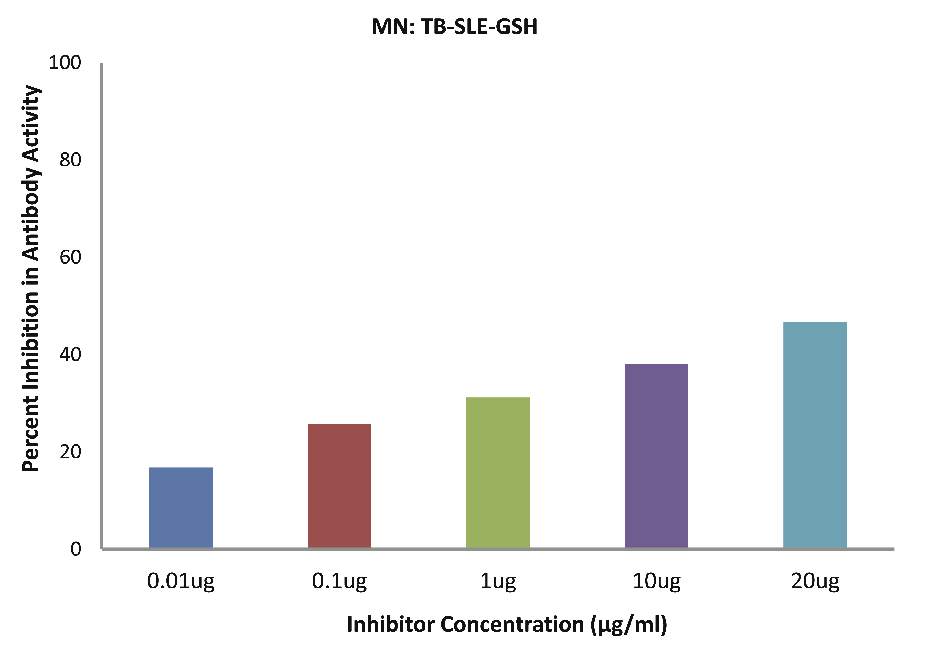
Figure 4f: After the addition of reduced glutathione, SLE-TB patients sera (n=5) exhibited a maximum 38.08% (p>0.05) inhibition in antibody activity where the inhibitor used were antigens in monocytes protein lysates of SLE-TB patients, at a concentration of 10µg/ml. The concentrations for inhibitors were 0.01, 0.1, 1.0, 10 and 20 µg/ml. Data are mean ±SD.
The results from this study elucidate that all the M. tuberculosis and SLE sera involved in this study showed a high degree of specificity for Ag85B (30 kDa) and native dsDNA, respectively. The data also shows that both non-mycobacterial native dsDNA and protein lysates prepared from monocytes of SLE patients, as well as mycobacterial 30 kDa protein antigens (Ag85B) were found to be recognized appreciably by anti-DNA autoantibodies present in SLE sera. On the contrary, Mycobacterial 30 kDa protein antigen (Ag85B), as well as protein lysates prepared from monocytes of M. tuberculosis patients were recognized appreciably by anti-tuberculosis antibodies present in M. tuberculosis sera, whereas non-mycobacterial native dsDNA showed poor recognition with the same anti-tuberculosis antibodies. Furthermore, co-culturing of monocytes obtained from M. tuberculosis, SLE or M. tuberculosis-SLE with 10 nM of reduced glutathione showed amelioration of reactive oxygen species (ROS) and TNF-α induced actions, which in turn, subsequently suppressed the immuno-bindings observed in monocytes of M. tuberculosis and SLE patients cultured without glutathione. Finally, our data shows that SLE patients are more susceptible to developing M. tuberculosis, as ROS and TNF-α in SLE patients could activate the replication of Ag85B (30 kDa) after bacilli infection.
Discussion
The data generated in the present study are strongly indicative for the appreciable correlation between autoimmune diseases like SLE and Mycobacterium tuberculosis infection. Inhibition ELISA results strongly suggest that all the TB positive sera selected in this study were having a high degree of specificity towards MTB Ag85B (30kDa). Similarly, our results illustrate the high degree of recognition of anti-DNA antibodies found in SLE sera by native dsDNA. The achievement of 50% inhibition in antibody activity in both the above diseases i.e. TB and SLE at a very low inhibitor concentrations are indicative of the presence of highly specific respective antibodies in all the sera selected for this study.
One of the interesting findings of this study was that the SLE patients were found to be more susceptible to developing TB than the vice-versa case. This is evident from the data indicating that autoantibodies found in SLE sera strongly recognized both native dsDNA, as well as mycobacterial Ag85B 30kDa; whereas, anti-TB antibodies found in TB sera strongly recognized only Ag85B 30kDa, while it exhibited low or negligible recognition with native dsDNA. However, antibodies found in sera of patients suffering from both TB along with SLE revealed high specificity for both the antigens i.e. native dsDNA and MTB 30 kDa.
An attempt was also made to evaluate the immuno-binding by employing in-vivo conditions i.e. by using cultured monocytes that were infected with bacilli (TB patients), as well as monocytes from SLE patients. The high percent maximum inhibitions as well 50% inhibitions in anti-TB and anti-DNA activities at extremely low inhibitor concentrations are suggestive of the appreciably high affinity immuno-interaction occurring between anti-TB antibodies and anti-DNA autoantibodies with antigens in monocyte protein lysates of TB patients and SLE patients, respectively.
The most striking finding in the present study is the reduced glutathione-induced down-regulation in binding of anti-TB antibodies and anti-DNA antibodies with antigens present in protein lysates prepared from monocytes of TB patients and SLE patients, respectively. Similar actions of reduced glutathione in monocytes obtained from blood of patients having both TB along with SLE further substantiates the antioxidant-induced suppression in immuno-binding. Furthermore, these results are correlating appreciably with the amount of TNF-α secreted in different monocyte cultures undertaken in this study. The importance of glutathione and its involvement in the above actions in monocytes of TB and SLE patients undertaken in our study could be best viewed by the following depicted relevance of glutathione. Glutathione (L-γ-Glutamyl-L-cysteinyl-glycine, GSH) is a sulfhydryl (-SH) antioxidant, antitoxin, and enzyme cofactor, which often attains millimolar levels inside cells, making it one of the most highly concentrated intracellular antioxidants.
The reducing power of GSH is a measure of its free-radical scavenging, electron-donating, and sulfhydryl-donating capacity. Reducing power is also the key to the multiple actions of GSH at the molecular, cellular, and tissue levels, and to its effectiveness as a systemic antitoxin.11 Experimental GSH depletion can trigger suicide of the cell by a process known as apoptosis.12,13 Antioxidants are the body’s premier resource for protection against the diverse free radical and other oxidative stressors to which it invariably becomes exposed.14 The antioxidant defense system is sophisticated and adaptive, and GSH is a central constituent of this system. Nowhere is its presence more important than in the mitochondria. The liver seems to have two pools of GSH; one has a fast turnover (half-life of 2-4 hours), while the other is avidly retained with a half-life of about 30 hours.15 The first corresponds to cytosolic GSH; the second mainly to mitochondrial GSH, which is known to be more tightly held.
Being directly in the path of airborne materials, the lung tissue is particularly at risk from oxidative stressors such as cigarette smoke, atmospheric pollutants, and other inhaled environmental toxins.16 GSH and GSH-associated enzymes present in the epithelial lining fluid (ELF) of the lower respiratory tract may be the first line of defense against such challenges.17-19 Sustained oxidative challenge to the lung results in depletion of GSH and other antioxidants from the lungs.
As with other cell types, the proliferation, growth, and differentiation of immune cells is dependent on GSH. Both the T and the B lymphocytes require adequate levels of intracellular GSH to differentiate, and healthy humans with relatively low lymphocyte GSH were found to have significantly lower CD4 counts.20 Intracellular GSH is also required for the T-cell proliferative response to mitogenic stimulation, for the activation of cytotoxic T “killer” cells,21 and for many specific T-cell functions, including DNA synthesis for cell replication, as well as for the metabolism of interleukin-2 (IL-2), which is important for the mitogenic response.22
Experimental depletion of GSH inhibits immune cell functions, sometimes markedly; and in a number of different experimental systems, the intracellular GSH of lymphocytes was shown to determine the magnitude of immunological capacity.21,23 Thus, intracellular GSH status plays a central role in the functioning of immune cells. In the auto-immune diseases of systemic lupus erythematosis (SLE) and rheumatoid arthritis (RA), and as seen in aging; T lymphocytes demonstrate depressed responsiveness to antigens and mitogens, perhaps because of insufficient IL-2 production. Patients with RA have low blood sulfhydryl (-SH) status, as do patients with Type II diabetes or with ulcerative colitis.23
Chronic viral infections may also trigger GSH depletion in circulating immune cells. Patients chronically infected with hepatitis C virus have low GSH in their circulating monocytes. Monocyte GSH levels are abnormal in early HIV-1 disease; then in patients with advanced disease, the GSH levels normalize in monocytes but the GSH/GSSG ratio become abnormal. Significant decreases in the plasma levels of both cysteine and cystine have also been documented in subjects with HIV-1 infection.24 Since cysteine is a rate-limiting precursor for GSH synthesis, an associated decrease of GSH in the lung ELF was highly suggestive of a systemic GSH insufficiency in these subjects.25 The most marked GSH decreases occurred in subjects who were asymptomatic but had CD-4 counts below 400. Both the abnormal cytokine expression and the progression to weight loss seen in HIV-1 disease may be linked (at least in part) to abnormalities in the uptake of GSH precursors by immune cells of HIV-1 subjects, and/or to abnormalities in their synthesis of GSH.
Conclusion
The data generated in the present study is suggestive of the fact that ROS generated as a consequence of stress of any kind in autoimmune SLE results in the activation of proinflammatory cytokine TNF-α, which in turn results in the production of anti-DNA autoantibodies. These SLE patients having high ROS levels become highly susceptible to MTB infection. Upon MTB infection, the ROS and TNF-α potentiate or activate the MTB 85B replication in SLE-TB patients. Such an activation of ROS or TNF-α and in turn the SLE and TB proliferation could be arrested or limited by the usage of reduced glutathione as revealed by our data. It is hoped that the findings of the present study may help in the better understanding of the pathogenesis of TB and SLE.
Acknowledgements
The authors reported no conflict of interest and no funding was received on this work.
References
1. Tasneem S, Islam N, Ali R. Crossreactivity of SLE autoantibodies with 70 kDa heat shock proteins of Mycobacterium tuberculosis. Microbiol Immunol 2001;45(12):841-846.
2. Wilkinson RJ, DesJardin LE, Islam N, Gibson BM, Kanost RA, Wilkinson KA, et al. An increase in expression of a Mycobacterium tuberculosis mycolyl transferase gene (fbpB) occurs early after infection of human monocytes. Mol Microbiol 2001 Feb;39(3):813-821.
3. Islam N, Kanost AR, Teixeira L, Johnson J, Hejal R, Aung H, et al. Role of cellular activation and tumor necrosis factor-alpha in the early expression of Mycobacterium tuberculosis 85B mRNA in human alveolar macrophages. J Infect Dis 2004 Jul;190(2):341-351.
4. Luong JM, Tan BT, Buchanan RR, Schachna L. Tumour necrosis factor inhibitor-related lupus: safety of switching agents. Clin Rheumatol 2010 May;29(5):551-553.
5. Wetter DA, Davis MD. Lupus-like syndrome attributable to anti-tumor necrosis factor alpha therapy in 14 patients during an 8-year period at Mayo Clinic. Mayo Clin Proc 2009 Nov;84(11):979-984.
6. Islam N, Haqqi TM, Jepsen KJ, Kraay M, Welter JF, Goldberg VM, et al. Hydrostatic pressure induces apoptosis in human chondrocytes from osteoarthritic cartilage through up-regulation of tumor necrosis factor-alpha, inducible nitric oxide synthase, p53, c-myc, and bax-alpha, and suppression of bcl-2. J Cell Biochem 2002;87(3):266-278.
7. Malemud CJ, Islam N, Haqqi TM. Pathophysiological mechanisms in osteoarthritis lead to novel therapeutic strategies. Cells Tissues Organs 2003;174(1-2):34-48.
8. Lowry OH, Rosebrough NJ, Farr AL, Randall RJ. Protein measurement with the Folin phenol reagent. J Biol Chem 1951 Nov;193(1):265-275.
9. Laemmli UK. Cleavage of structural proteins during the assembly of the head of bacteriophage T4. Nature 1970 Aug;227(5259):680-685.
10. Merril CR, Goldman D, Sedman SA, Ebert MH. Ultrasensitive stain for proteins in polyacrylamide gels shows regional variation in cerebrospinal fluid proteins. Science 1981 Mar;211(4489):1437-1438.
11. Meister A. Glutathione-ascorbic acid antioxidant system in animals. J Biol Chem 1994 Apr;269(13):9397-9400.
12. Duke RC, Ojcius DM, Young JD. Cell suicide in health and disease. Sci Am 1996 Dec;275(6):80-87.
13. Slater AF, Stefan C, Nobel I, van den Dobbelsteen DJ, Orrenius S. Signalling mechanisms and oxidative stress in apoptosis. Toxicol Lett 1995 Dec;82-83:149-153.
14. Cross CE, Halliwell B, Borish ET, Pryor WA, Ames BN, Saul RL, et al. Oxygen radicals and human disease. Ann Intern Med 1987 Oct;107(4):526-545.
15. Meister A. Mitochondrial changes associated with glutathione deficiency. Biochim Biophys Acta 1995 May;1271(1):35-42.
16. Kidd P. The free radical oxidant toxins of polluted air. In: Levine SA, Kidd PM. Antioxidant AdaptationÑIts Role in Free Radical Pathology. San Leandro, CA: Biocurrents; 1985:69-103
17. DeLeve LD, Kaplowitz N. Importance and regulation of hepatic glutathione. Semin Liver Dis 1990 Nov;10(4):251-266.
18. Pacht ER, Timerman AP, Lykens MG, Merola AJ. Deficiency of alveolar fluid glutathione in patients with sepsis and the adult respiratory distress syndrome. Chest 1991 Nov;100(5):1397-1403.
19. Bunnell E, Pacht ER. Oxidized glutathione is increased in the alveolar fluid of patients with the adult respiratory distress syndrome. Am Rev Respir Dis 1993 Nov;148(5):1174-1178.
20. Kinscherf R, Fischbach T, Mihm S, Roth S, Hohenhaus-Sievert E, Weiss C, et al. Effect of glutathione depletion and oral N-acetyl-cysteine treatment on CD4+ and CD8+ cells. FASEB J 1994 Apr;8(6):448-451.
21. Dröge W, Schulze-Osthoff K, Mihm S, Galter D, Schenk H, Eck HP, et al. Functions of glutathione and glutathione disulfide in immunology and immunopathology. FASEB J 1994 Nov;8(14):1131-1138.
22. Wu D, Meydani SN, Sastre J, Hayek M, Meydani M. In vitro glutathione supplementation enhances interleukin-2 production and mitogenic response of peripheral blood mononuclear cells from young and old subjects. J Nutr 1994 May;124(5):655-663.
23. Fidelus RK, Tsan MF. Glutathione and lymphocyte activation: a function of ageing and auto-immune disease. Immunology 1987 Aug;61(4):503-508.
24. Dröge W, Gross A, Hack V, Kinscherf R, Schykowski M, Bockstette M, et al. Role of cysteine and glutathione in HIV infection and cancer cachexia: therapeutic intervention with N-acetylcysteine. Adv Pharmacol 1997;38:581-600.
25. Buhl R, Holroyd K, Mastrangeli A, et al. Systemic glutathione deficiency in symptom-free HIV-1 seropositive individuals. Lancet 1989(Dec 2); 1294-1298.
|