Two important concepts support any recommendation in clinical practice guidelines: level of evidence and strength of recommendation. The level of evidence is based on the number and quality of studies that have addressed a particular clinical question leading to a particular recommendation. The sources of the highest level of evidence are acknowledged to be systematic reviews and meta-analyses of several large randomized clinical trials possessing high methodological quality.1 The lowest level of evidence comes from expert opinions based only on in vitro studies and animal research.
A systematic review is a specific and reproducible method to search, identify, select, appraise, and summarize all studies relevant to a particular healthcare question.2 The process involves several steps, the first of which is identifying a clinical question and formulating it in the patients, intervention, comparison, outcome (PICO) format.3 All relevant outcomes related to that particular clinical question are considered. Thereafter, previous systematic reviews that addressed that question are searched and reviewed to decide whether a new review would add to existing scientific knowledge. Once a decision is made to initiate a new systematic review, a search strategy is formulated and executed. Relevant studies are then selected from the search results and organized. Data fields are extracted and summarized using tables and pooled effect size when appropriate. The included studies are critically appraised, and the results are appropriately presented. Assessment of heterogeneity and publication bias is then performed. Finally, the manuscript is written illustrating these steps and results.
Identifying and formulating a question
A systematic review should have a clearly stated set of objectives. There are several ways a clinical research question can arise,4 most often while we are engaged in patient care or while reviewing the literature. The raw question in our mind then needs to be systematized and expressed scientifically in the PICO format, which is most suited for questions on therapies. Systematic reviews should have a comprehensive assessment of research questions and should include all relevant outcomes of the interventions involved. The authors of systematic reviews should be clear as to what outcomes are relevant to a specific intervention. However, selecting studies with too few outcomes may limit the comprehensive analysis of outcomes.
In the example, we will use to illustrate the concepts in this review, the question is on the therapeutic benefit of autologous stem cell transplantation (ASCT) in managing patients with previously untreated follicular lymphoma.5 The question in PICO format will be: “In adults with previously untreated follicular lymphoma, does ASCT improve event-free survival when compared to chemotherapy alone?” Notice that the question includes all the components of the PICO format, including the outcome of event-free survival. With such an intervention, other outcomes besides event-free survival are important; overall survival, quality of life, and adverse events, including secondary myelodysplasia, are important to be included in the systematic review. It is therefore important to include studies addressing other outcomes during the formation of a search strategy.
Before proceeding to the next step, a comprehensive search for previous systematic reviews addressing this question is performed, and the need for a new systematic review and meta-analysis is assessed. A prior systematic review and meta-analysis on a question of interest do not preclude performing a new one. For example, if new important studies have been published additionally to what is included in the previous systematic review, a new review is justified. In addition, if the previous systematic review had major methodological limitations, again a new one is warranted.
Formulation of a search strategy
This step includes deciding what and where to search for published and unpublished studies, followed by the search itself. The support of a librarian and good access to medical bibliographic databases are important here. Based on the research question, inclusion criteria are formulated, focusing on the elements in the PICO and the study design. The eligibility criteria for inclusion should be predefined. The decision to limit the search period and language should be carefully thought of as this may affect the number of included studies and the conclusion of the systematic review. In our example,5 the inclusion criteria are adults with follicular lymphoma (patients), ASCT or chemotherapy (intervention and the comparison), and randomized clinical trials (study design of interest).
In the present example, there are no exclusion criteria. Unpublished studies and studies published in languages other than English are not excluded. Moreover, ‘older studies’ are not excluded. Excluding older studies may be reasonable if they feature obsolete clinical practices and study methodologies.
The next task is the selection of bibliographic databases, the choice of which depends on the research question. For biomedical research, the search should include the U.S. National Library of Medicine (MEDLINE),6 Excerpta Medica dataBASE (EMBASE),7 and Cochrane Central Register of Controlled Trials (CENTRAL)8 in addition to other relevant databases. These databases can be searched directly or through vendors. It may also be worth searching databases that index the proceedings of medical conferences. Clinical trial registries constitute yet another potential source. A common mistake, which potentially may bias the results, is to exclude studies not yet published (also called grey literature).
When conducting the search itself, all possible variations of the terms of interest are searched using a free-text format. Medical Subject Headings (MeSH) terms, when available in the database (e.g., MEDLINE) should also be used for the search. The search is conducted on each element in the inclusion criteria and then combined using Boolean operators offered by the database search tool (e.g., AND). The search from different databases is combined in one document, which is later reviewed to select studies.
Selection of studies
The citations from different bibliographic databases are gathered in one document to make the review and study selection easy and organized. These citations are searched and studies not relevant to the review question are excluded. The first stage is to review the titles and abstracts of the imported citations and exclude studies based on information available in these if not relevant to the study question. At this stage, a large number of citations would have been excluded, especially if the search strategy was sensitive and comprehensive. For the remaining citations, full-text papers are retrieved to review and decide on the selection. If papers in languages other than English are searched, their full text needs to be translated. In all cases, it is important to record the reasons for excluding any paper.
To minimize bias, two reviewers independently perform the process of selection and exclusion. The results are presented in a flow diagram as recommended by the Preferred Reporting Items for Systematic Reviews and Meta-Analyses (PRISMA).9 In our example,5 the search returned 1661 citations; of which 1625 were excluded at the title and abstract stage. Thirty-six papers were then retrieved and reviewed, and 29 were excluded after reviewing the full text, resulting in seven papers finally included in the systematic review.
Extraction of information from the included studies
Early in the review, reviewers are required to develop two data extraction forms based on the review question. The first gives a non-judgmental description of the included studies, while the second one assesses their quality. We strongly recommend getting the finished forms reviewed by experts in the field of the question. Thereafter, they are piloted by the reviewers on data extraction before starting the final data extraction from the included studies. The extracted data is usually presented in a table format which contains baseline information from original studies. In our example, the extracted information (presented in tables) included the first author’s name, year of publication, study design, number of enrolled patients, and description of intervention and control. At the level of enrolled patients in each study, an additional description of key characteristics relevant to the description of this population should also be included. These are usually presented as means or medians for continuous variables and proportions for categorical variables. In our example, these include proportions of males and females, median age, proportions of high-risk patients, patients with poor performance status, and patients with bulky disease. The two reviewers need to independently perform data extraction from the included studies. Discrepancies are resolved by discussion or consultation with a third reviewer.
Summarizing the results
Results of the studies included in a systematic review are usually summarized in a table format. Many systematic reviews also include a synthesis of an overall estimate of the combined results. This process of pooling the results of different studies into one effect size using weighted averaging is called a meta-analysis. This is usually produced, where appropriate, for each outcome of the included studies in systematic reviews. Not all studies contribute similarly to the pooled (combined) effect size. There are two main ways of assigning weights to studies when pooling the results; fixed-effects and random-effects models.10 The fixed-effects model chooses a single effect size that is shared by all the studies. For example, if the number of participants was to be the chosen effect, studies with larger sample sizes would acquire more weightage.
On the other hand, the random-effects model assumes that the effect size varies within a study and between different studies. This variation leads to wider confidence intervals in the pooled effect size, making this a more nuanced approach to combining results in meta-analyses than the fixed-effects model. Random-effects model is preferred where there are inconsistencies of results between the selected studies. This concept will be further clarified later in this paper under the assessment of heterogeneity. Reviewers should decide at the stage of study protocol development which model to use; however, where necessary, both models can be used to supplement the argument of the systematic review in a sensitivity analysis.
The graphical representation of the effect size from different studies and the pooled effect size is called a forest plot. Figure 1 shows a hypothetical example of a forest plot. The columns in the plot represent the included studies, results from those, and the number of patients in the intervention and control (where appropriate) groups in each study (and the total of these studies). Sometimes, the weights of the studies are also included. In the figure itself, a square or a circle represents each study, and the bars on each side represent a 95% CI. A vertical line represents the line of neutrality or ‘the line of no effect.’ If the CI crosses the line of no effect, this indicates that the study result is not statistically significant. The sides of the line of no effect are usually labeled ‘favors intervention’ and ‘favors control’ as appropriate. These labels relate the effect sizes of each study and the pooled effect size. A different shape (e.g., diamond) from the individual studies usually represents the pooled effect, and the sides of the used shape usually represent the CI. A random-effects model is used in the forest plot in Figure 1. Figure 2 uses the same raw data as Figure 1 except for using a fixed-effects model to combine the results.

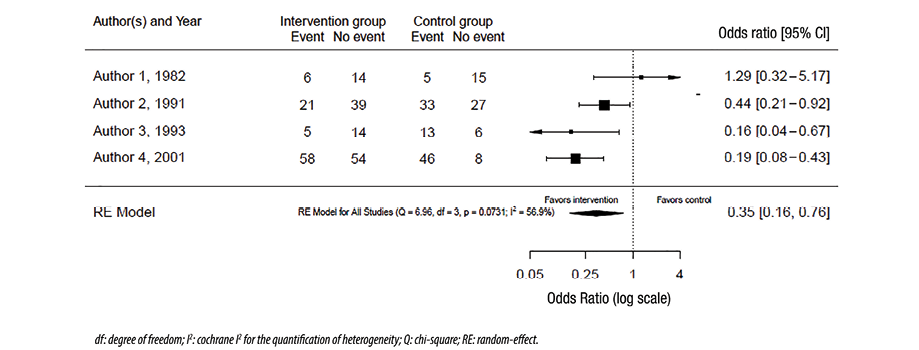 Figure 1: Forest plot with random-effects model.

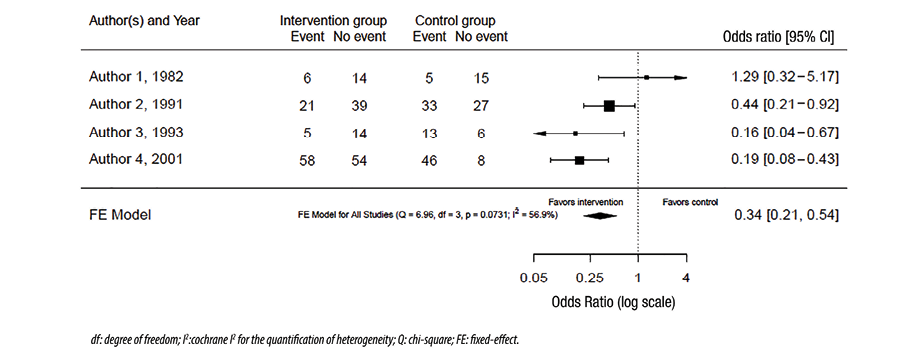 Figure 2: Forest plot with fixed-effects model.
Assessment of heterogeneity
Our confidence in the conclusion of systematic reviews and meta-analyses decreases if the results of the included studies are inconsistent. This inconsistency in the results is called heterogeneity.11 A pooled analysis with low heterogeneity inspires more confidence, as it indicates high inter-study consistency. Various methods can be used to assess heterogeneity. The first method is to visually inspect the forest plot of the study for the overlap between the 95% CIs of the different studies. Despite being simple, quick, and not needing statistical interpretations, forest plots are reliable only where the results are widely different between studies. In our hypothetical example, the visual inspection of the forest plot in Figure 1 suggests that the results are different, meaning that there is heterogeneity.
The second method, the chi-squared test, measures the variation in the results and assesses whether this variation is expected by chance. The question it asks is, ‘Are the results between studies different?’ Therefore, if the p-value is < 0.05, we conclude that the results are different and not expected by chance. This test is incorporated into many statistical packages used to perform meta-analyses, and the interpretation is simple. However, as most systematic reviews and meta-analyses include a relatively small number of studies, the chi-squared test is usually underpowered. This means that even if the p-value is > 0.05, we cannot conclude that there is no heterogeneity. Therefore, the test is helpful only when it indicates that there is heterogeneity, not vice versa. In the example, in Figure 1, the p-value = 0.07, and consequently, we cannot conclude that the results are inconsistent despite what the forest plot visually suggests.
Both forest plot inspection and chi-squared test are limited by their inability to quantify heterogeneity. For quantification, Cochrane I2 test is generally used. It estimates the magnitude of inconsistency beyond what is expected by chance.11 Values of over 50% indicate moderate heterogeneity that needs to be explained.11 Unless valid reasons for heterogeneity are provided, the confidence in the conclusion cannot be established, and many question the value of pooling the results in this setting. There are different ways of exploring heterogeneity to explain it. These need to be stated a priori at the stage of study protocol development. One option, when there is substantial heterogeneity, is not to perform the meta-analysis. The random-effects model incorporates heterogeneity into wider CIs, and therefore it is a better option than the fixed-effects model when inconsistency in study results is seen. Subgroup analysis is another method to explore heterogeneity. In this method, studies are divided into subgroups based on a specific characteristic, and the heterogeneity is estimated for each of these subgroups. If the substantial heterogeneity disappears, one can conclude that the effect size is different in different subgroups, which may explain the heterogeneity. This conclusion is usually supplemented by a statistical test called the test of interaction.12 Finally, regression (called meta-regression) can be used to explore heterogeneity in a meta-analysis. Detailing these methods is beyond the scope of this review.
Assessment of publication bias
Authors of systematic reviews need to watch out for publication bias while selecting studies and should seek to minimize it. A common source of bias in systematic reviews is to focus on highly visible studies. Studies with positive results are more likely to be published and cited.13 Those published by high-impact journals also tend to be cited more. Focusing on these carries the risk of missing good quality low impact studies. It may also cause the reviewer to miss peer-reviewed unpublished studies which might well contain valuable new information. An emerging source of publication bias is the belief that studies in foreign languages are too difficult or too expensive to translate. With translation software becoming increasingly powerful and accurate, continued avoidance of this rich source of scientific information seems no longer justifiable.
In short, publication bias can impact the conclusion and the combined outcome of a systematic review. Although there are several statistical methods to assess publication bias, they are limited in their ability to find it, especially when the number of the included studies is small. In addition, an abnormal distribution revealed by these methods need not be specific to publication bias.
The funnel plot method is commonly used to assess publication bias in systematic reviews. In this method, the effect size (x-axis of the forest plot) is plotted against the sample size (or a measure reflecting the weight of the study). Each circle on this plot represents a study. The assumption is that the distribution of these circles should be symmetrical, especially when it comes to small studies. If the visual inspection of the plot indicates an asymmetry in the distribution, especially when there are fewer circles on the side of the small negative studies, this suggests publication bias. The distribution can also be assessed using statistical tools like Egger’s test. If the p-value is < 0.05, the test indicates that the distribution is not a symmetrical, suggesting publication bias. However, like the chi-squared test in heterogeneity assessment, this test is also underpowered; therefore, even if it fails to indicate asymmetry, publication bias cannot be ruled out. In another hypothetical example in Figure 3, the visual inspection of the funnel plot is not indicative of asymmetry, and therefore we do not have evidence of publication bias. However, in Figure 4, the plot is asymmetrical, suggesting that small studies favoring controls are not included likely due to
publication bias.

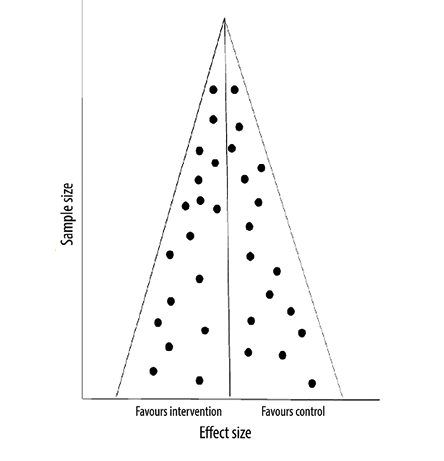 Figure 3: Funnel plot with no asymmetry.

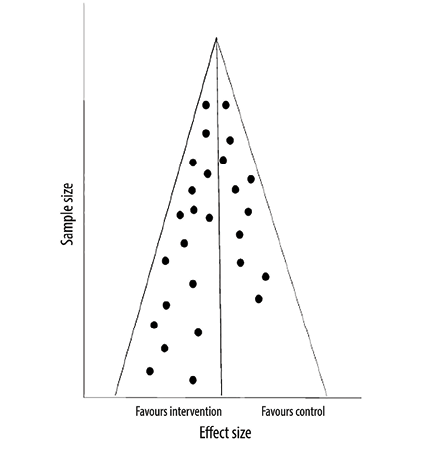 Figure 4: Funnel plot with asymmetry.
Critical appraisal of the included studies
This is the most important step in a systematic review. The conclusion of any review depends on the quality of the included studies. The role of the authors of a review is to assess the quality of the included studies and present the results in an explicit way for the readers. Additionally, the reviewers should ensure that their conclusions and recommendations are influenced solely by empirical evidence on the quality of the included studies, carefully avoiding all subjectivity.
There are several methods to assess and present the quality of the included studies in a systematic review. Different methods are used for different study designs. Jadad score is a well-described method to assess the methodological quality of randomized clinical trials.14 This method assesses each study across several domains: randomization, blinding, dropout, inclusion and exclusion criteria, adverse events, and statistical analysis and presents a total score for that study in a table or a figure format. A more recently described method is Grading of Recommendations, Assessment, Development, and Evaluations, which has been increasingly used to evaluate randomized clinical trials.15 This method assesses outcomes rather than individual studies. The following domains are evaluated in this tool: risk of bias, imprecision, inconsistency, indirectness, and publication bias. Finally, the Cochrane risk of bias tool is also increasingly used, especially in Cochrane reviews.16 In contrast to the above three methods used for the assessment of clinical trials, the Newcastle-Ottawa Scale is used to assess the quality of observational studies.17 This method uses star points to evaluate three main areas: selection, comparability, and exposure. Again, the total score is representative of studies and not outcomes.
Conclusion
A systematic review is a specific and reproducible method to search, identify, select, appraise, and summarize all studies relevant to a particular health care question. The synthesis of a combined result of the included studies is called a meta-analysis and is usually presented in a forest plot. Publication bias, common in systematic reviews, is difficult to assess accurately. Critical appraisal of the included studies is the most important step in a systematic review as it affects the confidence in the accuracy of the
pooled result.
Disclosure
The authors declared no conflicts of interest. No funding was received for this study.
references
- 1. Burns PB, Rohrich RJ, Chung KC. The levels of evidence and their role in evidence-based medicine. Plast Reconstr Surg 2011 Jul;128(1):305-310.
- 2. Gopalakrishnan S, Ganeshkumar P. Systematic reviews and meta-analysis: understanding the best evidence in primary healthcare. J Family Med Prim Care 2013 Jan;2(1):9-14.
- 3. Eriksen MB, Frandsen TF. The impact of patient, intervention, comparison, outcome (PICO) as a search strategy tool on literature search quality: a systematic review. J Med Libr Assoc 2018 Oct;106(4):420-431.
- 4. Tully MP. Research: articulating questions, generating hypotheses, and choosing study designs. Can J Hosp Pharm 2014 Jan;67(1):31-34.
- 5. Al Khabori M, de Almeida JR, Guyatt GH, Kuruvilla J, Crump M. Autologous stem cell transplantation in follicular lymphoma: a systematic review and meta-analysis. J Natl Cancer Inst 2012 Jan;104(1):18-28.
- 6. MEDLINE®: Description of the Database. In: U.S. National Library of Medicine, 2020.
- 7. Elsevier. Embase Coverage and Content | Elsevier. In, 2020.
- 8. Cochrane Controlled Register of Trials (CENTRAL) | Cochrane Library. In, 2020.
- 9. Moher D, Liberati A, Tetzlaff J, Altman DG. PRISMA Group. Preferred reporting items for systematic reviews and meta-analyses: the PRISMA statement. PLoS Med 2009 Jul;6(7):e1000097.
- 10. Borenstein M, Hedges LV, Higgins JP, Rothstein HR. A basic introduction to fixed-effect and random-effects models for meta-analysis. Res Synth Methods 2010 Apr;1(2):97-111.
- 11. Higgins JP, Thompson SG, Deeks JJ, Altman DG. Measuring inconsistency in meta-analyses. BMJ 2003 Sep;327(7414):557-560.
- 12. Richardson M, Garnera P, Doneganb S. Interpretation of subgroup analyses in systematic reviews: a tutorial. Clinical Epidemiology and Global Health 2019;7(2):192-198.
- 13. Sedgwick P. What is publication bias in a meta-analysis? BMJ 2015 Aug;351:h4419.
- 14. Berger VW, Alperson SY. A general framework for the evaluation of clinical trial quality. Rev Recent Clin Trials 2009 May;4(2):79-88.
- 15. Guyatt GH, Oxman AD, Vist GE, Kunz R, Falck-Ytter Y, Alonso-Coello P, et al; GRADE Working Group. GRADE: an emerging consensus on rating quality of evidence and strength of recommendations. BMJ 2008 Apr;336(7650):924-926.
- 16. Sterne JA, Savović J, Page MJ, Elbers RG, Blencowe NS, Boutron I, et al. RoB 2: a revised tool for assessing risk of bias in randomised trials. BMJ 2019 Aug;366:l4898.
- 17. Wells G, Shea B, O’Connell D, Peterson J, Welch V, Losos M, et al. The Newcastle-Ottawa Scale (NOS) for assessing the quality of nonrandomised studies in meta-analyses. [cited 2021 July 17]. Available from: http://www.ohri.ca/programs/clinical_epidemiology/oxford.asp.