Overweight and obesity are still major public health problems around the world. The prevalence of obesity varies from 10 to 40% in different populations.1 Unfortunately, the prevalence of obesity has increased in industrialized countries and also in developing ones, including Iran.2 Several studies have confirmed the relationship between overweight and obesity and its markers with a wide range of chronic diseases and even correlation with malignancies that may threaten public health.3 When overweight and obesity occur in childhood, considering the time-bound nature of many pathogenic processes associated with obesity, there are serious concerns.
Currently, various methods are used to assess overweight and obesity. The most popular tool is body mass index (BMI; ratio of weight by the square of height). Based on the US Center for Disease Control (CDC) percentiles, childhood overweight and obesity are considered those in the 85–94 and > 95 percentiles, respectively.4 Despite the simplicity and universal use of BMI, it is not the perfect scale to assess central obesity, which is the main predictor for obesity-related disorders.5
Due to the limitations of BMI, alternative scale indicators such as waist circumference (WC) and waist-to-hip ratio (WHR) have been introduced, but each has its limitations. For instance, measuring WC may be time-consuming and problematic in terms of cultural and environmental issues. Similarly, after eating, WC may be affected by abdominal distention.6 Given the limitations of these criteria, new strategies are required to find a better scale to measure overweight and obesity, particularly focusing on visceral obesity.
Researchers have shown the use of neck circumference (NC) as a simple screening method to identify obesity and overweight.6–8 The association between NC, central obesity, and abnormal metabolic status has been shown.9 Our study aimed to investigate the correlation between different anthropometric methods in identifying children aged 6–17 years with a high BMI and to determine the best NC cutoff value for easier identification of overweight or obese children.
Methods
We conducted a cross-sectional study in 2012 of 6–17 year old students from different areas of Ahvaz, Iran. The study was approved by the Ethics Committee of Ahvaz Jundishapur University of Medical Sciences.
After obtaining the written informed consent from parents, a total of 864 students were selected by a two-stage cluster sampling method. Each gender was divided into 12 age groups (one age group for each year between six and 17), and 36 children were enrolled in each category. Based on a history and physical examination, children with goiter, or other neck masses were excluded from the study. Anthropometric data of students, including height, and weight, and neck, waist, and arm circumference were measured and recorded by two trained physicians who were blinded to the objectives of the study. Weight and height were measured using scales with an accuracy of 0.1 kg and 0.1 cm, respectively. NC was measured in the local situation immediately below the larynx (thyroid cartilage) and perpendicular to the longitudinal axis of the neck (so that the measuring tape in front and back of the neck was at the same height). We used a flexible measuring tape and took the measurement while the child was standing and looking straight ahead with their shoulders relaxed and fallen. WC was measured while the child was standing at the end of a normal exhalation at the midpoint between the lower edge of the last rib, and the upper edge of the iliac crest, using a fabric measuring tape. Mid-arm circumference was also measured while the arm was bent at a 90° angle at the midpoint of the interface between acromion processes and olecranon. BMI was calculated for all children using the standard formula, and BMI percentiles were determined for each individual with respect to age and gender. Accordingly, children with a BMI percentile < 85% were considered as normal weight, and those with a percentile ≥ 85% were considered as overweight and obese.4
In both genders, the mean and standard deviation (SD) of height, weight, waist, NC, mid-arm circumference, and BMI were calculated. In each of these subgroups, the mean anthropometric indices of children with normal and high BMI were compared.
For comparison purposes, children were divided by gender into two age groups: < 10, and > 10 years old. After reviewing the data for normal distribution, Pearson’s correlation coefficient (r) calculated the correlation between the NC, BMI, and the other anthropometric indicators. To identify cases of overweight/obesity at different ages and in both genders, receiver operating characteristic curve analysis (ROC) was used to determine the best cutoff value of NC, and the power and diagnostic value (sensitivity and specificity) of this criterion. Accordingly, if the area under the curve (AUC) was > 90%, test accuracy was considered excellent, an AUC between 90–70% good, and between 70–50% was acceptable. A test accuracy of < 50% was unacceptable.10
In this study, reference screening method was considered to determine overweight/obesity and BMI values, and the value of NC was compared with BMI as a new screening method. Data were analyzed using SPSS Statistics (SPSS Statistics Inc., Chicago, US) version 18.
Results
The total of 864 students was assessed anthropometrically. The mean BMI of male and female children was 19.5±3.6 and 19.0±3.4 kg/m2, respectively. Similarly, the mean NC in males and females was 31.4±3.9 and 29.6± 2.6 cm, respectively.
Table 1: Demographics and patient’s characteristics (n = 392).
|
Age |
35.1±12.9 |
|
Gender |
|
|
Male |
198 (50.5) |
|
Female |
194 (49.5) |
|
Marital status |
|
|
Single |
118 (30.1) |
|
Married |
274 (69.9) |
|
Insurance coverage |
373 (95.2) |
|
Residential setting |
|
|
Urban |
270 (68.9) |
|
Rural |
122 (31.1) |
|
Education |
|
|
Preliminary |
19 (4.8) |
|
Intermediate |
284 (72.5) |
|
College |
89 (22.7) |
|
Below poverty line |
52 (13.3) |
|
Familial support |
367 (93.6) |
|
Religious belief |
320 (81.6) |
|
Strongly religious |
50 (12.8) |
|
Disease-induced malformation |
13 (3.3) |
|
Smoking |
49 (12.5) |
|
Alcohol |
8 (2.0) |
|
Illegal drug use |
7 (1.8) |
|
History of mood disorder |
9 (2.3) |
|
Surgery type |
|
|
Hepatoportal procedure |
61 (15.6) |
|
Thyroid mass |
73 (18.6) |
|
Trauma surgery |
18 (4.6) |
|
Abdominal wall hernia repair |
31 (7.9) |
|
Breast mass |
13 (3.3) |
|
Benign anorectal disease |
48 (12.2) |
|
Gastrointestinal tumor resection |
22 (5.6) |
|
Laparotomy due to acute abdomen |
59 (15.1) |
|
Other surgeries |
24 (6.1) |
|
Non-operative management |
67 (17.1) |
|
Reoperation |
10 (2.6) |
Table 2: HADS subscales according to admission week, n (%).
|
Normal |
304 (77.6) |
6 (21.4) |
250 (63.8) |
13 (46.4) |
|
Doubtful |
49 (12.5) |
13 (46.4) |
79 (20.2) |
13 (46.4) |
1HADS: depression subscale at the time of admission; 2HADS: depression subscale in the second week; 3HADS: anxiety subscale at the time of admission;
4HADS: anxiety subscale in the second week.
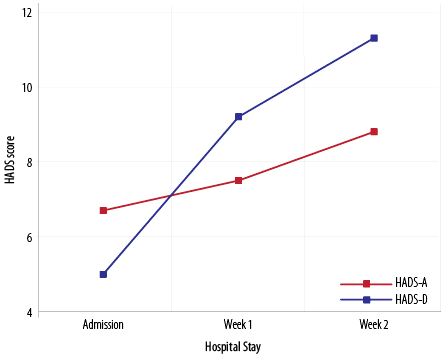
Figure 1: Hospital anxiety and depression scale (HADS) scores over the course of hospital stay.
Table 3: Binary logistic regression analysis according to each subscale of HADS in each week of hospitalization and associated predictors in the univariate analysis.
|
Female |
2.1 (1.0–4.2) * |
N/A |
2.5 (1.4–4.4) * |
1.7 (0.0–1.0) |
|
Academic education |
N/A |
N/A |
0.6 (0.3–1) * |
N/A |
|
Urban living |
1.1 (0.6–2.2) |
N/A |
1.4 (0.8–2.7) |
N/A |
|
History of mood disorder |
5.4 (0.9–33.5) |
N/A |
10.7 (2.0–56.5) * |
N/A |
|
Serious diseases |
1 (1.0–1.1) |
N/A |
N/A |
N/A |
|
Morbidity |
0.0 (-) |
N/A |
N/A |
N/A |
|
Familial support |
0.4 (0.1–1.3) |
N/A |
N/A |
N/A |
|
Complication |
1.0 (0.4–2.8) |
N/A |
N/A |
N/A |
|
Reoperation |
0.0 (-) |
N/A |
N/A |
N/A |
|
Underlying diseases |
N/A |
0.6 (0.2–2.0) |
0.9 (0.6–1.3) |
N/A |
|
Employed |
N/A |
1.3 (0.8–1.9) |
N/A |
N/A |
|
Alcohol |
N/A |
0.0 (-) |
N/A |
N/A |
|
Admission length |
N/A |
N/A |
N/A |
1.1 (1.0–1.2) * |
|
Need to surgery |
N/A |
N/A |
N/A |
0.6 (0.0–1.0) |
Data displayed as OR (95% CI). *p < 0.050. 1HADS: depression subscale at the time of admission; 2HADS: depression subscale in the second week; 3HADS: anxiety subscale at the time of admission; 4HADS: anxiety subscale in the second week.
N/A: Not Applicable (p > 0.200 in univariate analysis).
Comparison of children with high and normal BMI disclosed a significant difference in the mean weight, WC, NC, and arm circumference in both genders and age groups (p < 0.001) [Table 1]. However, no significant difference was found in their mean height (p > 0.050). Boys < 10 years old with normal BMI had a greater mean NC than girls (p = 0.002), but this difference was not significant in girls with a high BMI (p = 0.200).
Tables 2 and 3 show the AUC values, cutoff values, and sensitivity and specificity of NC in identifying children with overweight/obesity by age. Based on these findings, and considering the AUC of 70–90% in all age groups, NC could accurately identify boys and girls with a high BMI.
The sensitivity and specificity of this screening method for males were between 60.0–88.9% and 71.4–88.5%, respectively, and 71.4–87.5% and 67.7–82.8% for females, respectively. Table 4 shows the correlation r coefficient between anthropometric parameters in different age categories. There was a positive correlation of NC with BMI and waist and mid-arm circumference for all age groups in both genders. There were also positive correlations between BMI and waist and arm circumference.
Discussion
Our study revealed the value of measuring NC to screen for overweight/obesity in children and adolescents. Further, we were able to determine a reliable cutoff value of NC to diagnose overweight/obesity in both genders. Limitations of previous methods used to assess obesity in children and adults2,6 led researchers to find other ways to screen this condition, including the measurement of NC as a new indicator of central obesity.6-8 In addition to low cost, simplicity, and availability, this method could be a screening tool to predict respiratory complications during surgery11 and abnormal metabolic status.9
There is a significant correlation between the value of NC, body fat percentage,12 very low-density lipoprotein (VLDL), triglyceride (TG), total cholesterol (TC)/high density lipoprotein (HDL), and TG/HDL.13 Bizheh et al,13 stated that the value of NC and WC compared to other indices (BMI and waist to height ratio) has a higher accuracy in predicting the risk of atherosclerosis, and recommended the use of NC measurement for risk assessment in the middle-aged.
In our study, in both age groups and genders, the mean weight, waist, NC, and arm circumference between subjects with high and normal BMI were significantly different, but their mean height values were in the same range (subjects with higher BMI were not taller). This was consistent with a study performed in the United States, which found that boys in the younger age group (< 10 years), with a normal BMI, had significantly higher mean NC values than girls.6 However, in those with high BMI, their study also found higher NC values for boys (while boys and girls were same in our study).
In our study, like other studies, in all age categories of both genders, there was a positive and strong correlation between NC and BMI, and waist and arm circumference. Also, BMI and WC and BMI and mid-upper arm circumference were positively correlated.6,7,14,15
We observed AUC values of 70–90% in all age groups, which suggests that NC can accurately identify children with a high BMI. Further, the cutoff values of NC to identify children with overweight/obesity in different age categories in boys was 27.5–38.3 and in girls was 26.7–33.4. These results were close to the previous studies and small differences between the cutoffs could be explained by ethnic variation [Table 5]. Furthermore, differences in sensitivity and specificity of the NC measuring method in different studies could be due to sample size and age range.
There are several limitations of this study that should be considered in the interpretation of results. The study was conducted in the city of Ahvaz, and the inclusion of data from children living in rural areas might change the results. The analysis was based on the ROC calculation and are, generally, dependent on the prevalence of disease in the study population. So the results of the present study may be unusable in areas with much lower prevalence of obesity.
This was the first study in Iran, which examined the value of NC with a wide range in children in both gender, and the results can be used as a primary clinical guide to identify children with overweight and obesity.
Based on the findings of this study, we recommended that an extensive study is performed to determine a nomogram and percentiles of NC in different age groups. We also suggest researchers look for the relationship between NC, blood pressure, and metabolic syndrome components, such as diabetes and hyperlipidemia.
Conclusion
Compared to other methods, NC measurement is easier for clinicians and more comfortable for children. This study confirmed the results of previous studies on the usefulness and reliability of this method in identifying overweight/obesity in children (especially central obesity).
Disclosure
The authors declared no conflicts of interest. No funding was received for this study.
Acknowledgements
This paper is issued from residential thesis (Mohammad-Reza Taheri). The authors would like to thank the Deputy Vice-Chancellor for Research Affairs of Ahvaz Jundishapur University of Medical Sciences, especially the Research development Center of Abuzar Children’s Hospital for their technical support.
references
- Lobstein T, Frelut ML. Prevalence of overweight among children in Europe. Obes Rev 2003 Nov;4(4):195-200.
- Veghari G, Sedaghat M, Banihashem S, Moharloei P, Angizeh A, Tazik E, et al. Trends in waist circumference and central obesity in adults, northern iran. Oman Med J 2012 Jan;27(1):50-53.
- Zagami SE, Golmakani N, Shandiz FH, Saki A. Evaluating the Relationship between Body Size and Body Shape with the Risk of Breast Cancer. Oman Med J 2013 Nov;28(6):389-394.
- Gahagan S. Overweight and Obesity. In: Behrman RE, Kliegman M, Stanton BF, Schor NF, Geme W. St, editors. Nelson textbook of Pediatrics. 19 ed. Philadelphia; Sunders;2011. p. 179-188.
- Walton C, Lees B, Crook D, Worthington M, Godsland IF, Stevenson JC. Body fat distribution, rather than overall adiposity, influences serum lipids and lipoproteins in healthy men independently of age. Am J Med 1995 Nov;99(5):459-464.
- Nafiu OO, Burke C, Lee J, Voepel-Lewis T, Malviya S, Tremper KK. Neck circumference as a screening measure for identifying children with high body mass index. Pediatrics 2010 Aug;126(2):e306-e310.
- Hatipoglu N, Mazicioglu MM, Kurtoglu S, Kendirci M. Neck circumference: an additional tool of screening overweight and obesity in childhood. Eur J Pediatr 2010 Jun;169(6):733-739.
- Ben-Noun L, Sohar E, Laor A. Neck circumference as a simple screening measure for identifying overweight and obese patients. Obes Res 2001 Aug;9(8):470-477.
- Laakso M, Matilainen V, Keinänen-Kiukaanniemi S. Association of neck circumference with insulin resistance-related factors. Int J Obes Relat Metab Disord 2002 Jun;26(6):873-875.
- Van der Schouw YT, Verbeek AL, Ruijs JH. ROC curves for the initial assessment of new diagnostic tests. Fam Pract 1992 Dec;9(4):506-511.
- Nafiu OO, Burke CC, Gupta R, Christensen R, Reynolds PI, Malviya S. Association of neck circumference with perioperative adverse respiratory events in children. Pediatrics 2011 May;127(5):e1198-e1205.
- Pillai C, Udhoji P, Rathod S, Pillai K. Comparison of body mass index, body fat percentage and neck circumference as tools for evaluation of obesity. Natl J Physiol Pharm Pharmacol 2012;2(2):167-171 .
- Bizheh N, Abdollahi AR, Jaafari M, Ajam Zibad Z. Relationship between neck circumference with cardiovascular risk factors. J Babol Univ Med Sci 2011;13(1):36-43.
- Lou DH, Yin FZ, Wang R, Ma CM, Liu XL, Lu Q. Neck circumference is an accurate and simple index for evaluating overweight and obesity in Han children. Ann Hum Biol 2012 Mar;39(2):161-165.
- Atwa H, Fiala LM, Handoka NM. Neck circumference as an additional tool for detecting children with high body mass index. J Am Sci 2012;8(10):442-446.
- Olubukola N, Burke C, Lee J, Voepe lT, Malviya SH, Tremper K. Neck circumference as a screening measure for identifying children with high body mass index. Pediatrics 2010;126:306-310.