|
Introduction
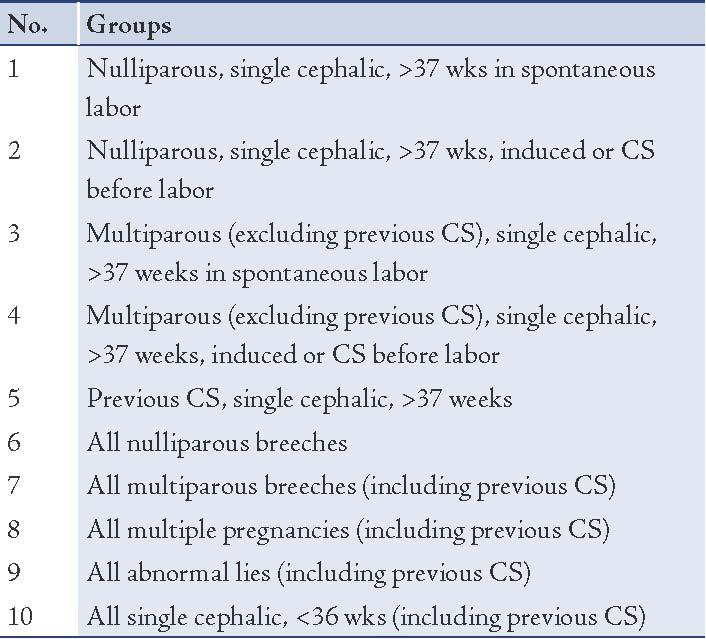
High cesarean birth rates are an issue of international public health concern.1 Worries over such increases have led the World Health Organization to advise that Cesarean Section (CS) rates should not be more than 15%,2 with some evidence that CS rates above 15% are not associated with additional reduction in maternal and neonatal mortality and morbidity.3 Analyzing CS rates in different countries, including primary vs. repeat CS and potential reasons of these, provide important insights into the solution for reducing the overall CS rate. Robson,4 proposed a new classification system, the Robson Ten-Group Classification System to allow critical analysis according to characteristics of pregnancy (Table 1). The characteristics used are:
(i) single or multiple pregnancy
(ii) nulliparous, multiparous, or multiparous with a previous CS
(iii) cephalic, breech presentation or other malpresentation
(iv) spontaneous or induced labor
(v) term or preterm births.
Table 1: Robson’ 10-Group Classification.
This classification system has been used in single-institution studies, jurisdictional, and national registries and recently with international comparisons.5,6 The aim of this study was to investigate CS rates at a tertiary care centre in Oman and make analysis based on the 10-group classification.
Methods
This cross sectional study was conducted for a period of 6 months from June 2009 to November 2009 at Khoula hospital, a tertiary care hospital in Muscat, Oman. All the women delivered during this period in the labor ward were included. All relevant obstetric information (parity, mode of previous deliveries, previous CS and indications, gestational age, onset of labor, spontaneous or induced labor) was entered on a questionnaire and then into Microsoft excel. Results were calculated at the end of this period. Before proceeding, approval was sought from hospital ethical and research committee.
Results
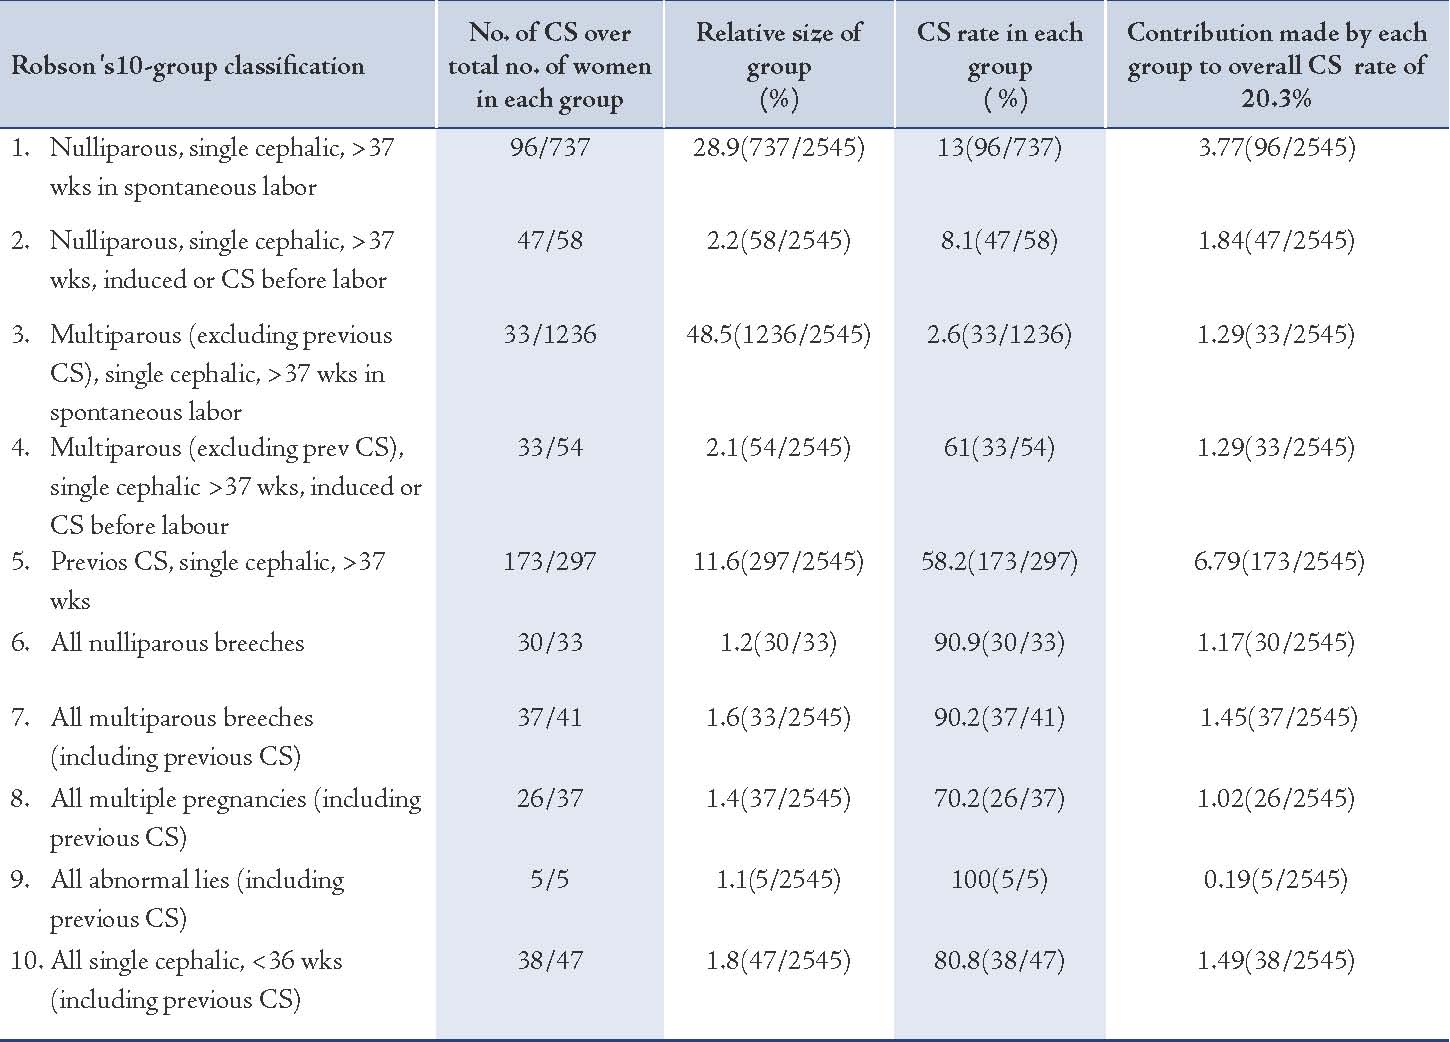
The total number of women delivered for the period of 6 months was 2545, out of which CS deliveries were 518. Overall, CS rate calculated for Khoula hospital in this specified period was 20.3%, (Table 2). On analysis of CS according to Robson’s classification, different rate of each group was shown separately.
Group 5 (previous CS group) made the greatest contribution to the total CS rate. Group 1 (Nullipara, Term, spontaneous deliveries) had the second highest contribution to the CS rate and then group 2 (Nullipara, Term, elective CS or after failed induction) placed third.
Group 5 was further analyzed according to the indications of CS. Out of 173 CS procedures, elective CS were 79 and emergency CS were 94. CS rate was calculated in each group separately to determine their contribution to the overall CS rate.
Table 2: Overall CS rate (%) 518/2545 - 20.3%.
Discussion
For the last 30 years, there has been a public concern about increasing CS rates.5 The increase has been a global phenomenon, the timing and rate of the increase has differed from one country to another, and marked differences in rates persist.7
The CS rate reported in Australia.8 ranges from 28% in Tasmania to 33.1% in Queensland.9 This CS rate is higher than Norway’s (13.9%),10 similar to Asian countries (27.3%),11 but lower than that reported in the USA (31.1%).12 Another study from Iran reported an increase from 35% to 40%,13 while this study gave the rate of 20.3%, which is quite low compared to other reports but still above the WHO criteria. In comparison with other international studies, the current study results were quite reassuring. (Fig. 1)
While analyzing the CS rate, the number of CS performed should be simple to determine but the indications will be more difficult to standardize. There should be one main indication rather than a list of indications, using an agreed standard hierarchical system.14 The 10-group classification has made possible comparisons of CS over time in one unit and between different units, in different countries.5
As shown in this study, when analyzing CS rates, the main contributing groups to the overall CS rate were the Previous CS (Group 5) and Primigravida groups, (Groups 1 and 2), i.e, giving the contribution rate of 60%, which is similar to other studies.4,6,7 In all these studies, these 3 groups contributed to 50% or more of the total CS rate. The contribution of primary CS rate to the overall CS rate by single cephalic term pregnancies (Groups 1, 2, 3, 4) was 40% in this study, while in others, primary CS rate was approaching 50%.15
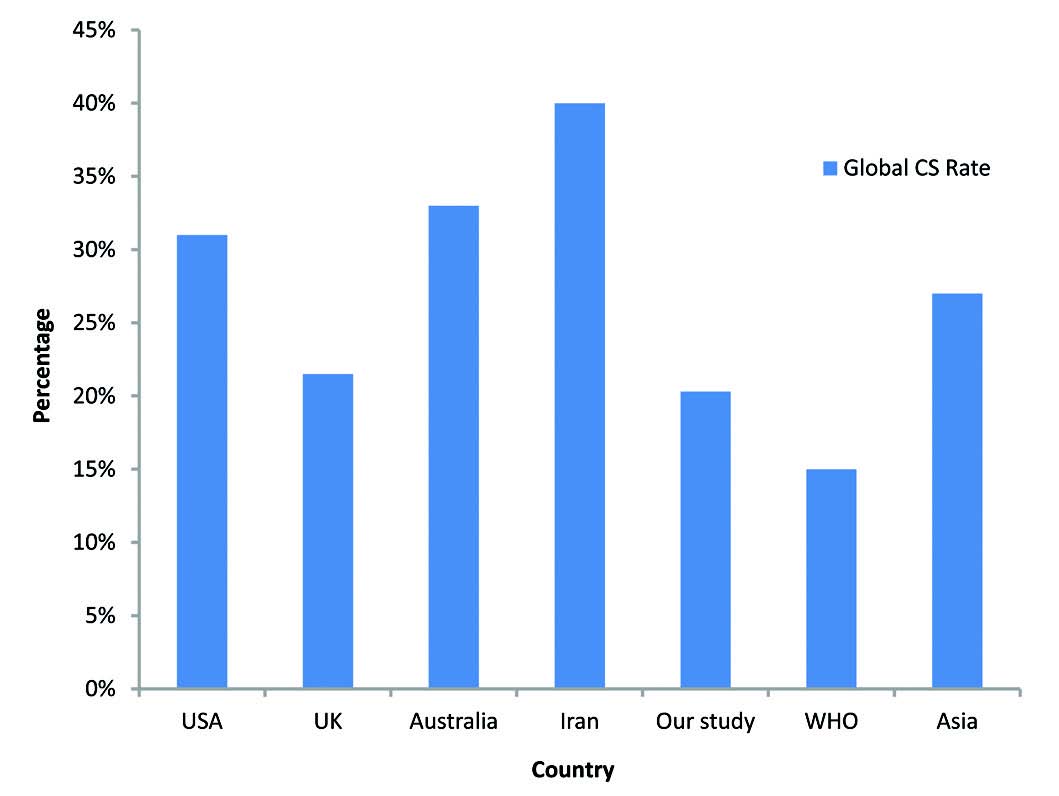
Figure 1: CS rate in different countries.
On analysis of indications of CS in primigravida group with spontaneous labor (Group 1), 59 CS were performed out of 96, following non-reassuring cardiotocogram (CTG). Obviously, this fraction can be lowered by reducing the interobserver difference in interpretation of CTG by implementing frequent teaching workshops for the obstetric staff.16 There is role of STAN system to determine fetal status in labor but it needs extensive training and experience.17
The study results showed that one third (33%) of the total CS rate was contributed by Group 5 (173 repeat CS out of 297 laboring women with previous 1 CS), which is slightly higher than other studies (one-fourth of the total CS rate).7,15 The reason for the larger contribution of group 5 towards the total CS rate is the bigger size of families and repeat high order CS in Oman. It was seen that 79 CS out of 297 were done due to the indication of repeat 3rd CS, giving an unavoidable fraction. Vaginal Birth After Cesarean (VBAC) was offered to the rest of the women, 32 women refused and chose elective CS, while 186 women opted for VBAC. Successful VBAC gave a percentage of 67%, comparable to international standards.18
Groups 6-10 were smaller groups with high percentages of CS. High percentage in these groups was due to unavoidable obstetric indications. When compared with other studies internationally, almost all studies conveyed comparable results in groups 6-10.7,8,15,16
This was the first time to the authors' knowledge, that CS rates in Oman have been investigated according to the 10-group classification in an attempt to ascertain which clinically relevant groups were contributing to the increasing CS rate over time.
Conclusion
Even though the overall CS rate in the study is not high as compared to international studies, contribution of repeat CS is 33% of the overall CS rate. It is important that efforts to reduce the overall CS rate should focus on reducing the primary CS rate. More analytical studies based on Robson’s 10-group classification are needed locally, to evaluate the indications of CS within each group.
Acknowledgements
The authors reported no conflict of interest and no funding was received in this work.
References
1. van Roosmalen J, van der Does CD. Caesarean birth rates worldwide. A search for determinants. Trop Geogr Med 1995;47(1):19-22.
2. World Health Organization. Monitoring emergency obstetric care: a handbook. Geneva, Switzerland; 2009.
3. Althabe F, Belizán JM. Caesarean section: the paradox. (comment). Lancet 2006 Oct;368(9546):1472-1473.
4. Robson MS. Can we reduce the caesarean section rate? Best Pract Res Clin Obstet Gynaecol 2001 Feb;15(1):179-194.
5. Robson M. Classification of caesarean sections. Fetal Matern Med Rev 2001;12:23-39 .
6. Brennan DJ, Robson MS, Murphy M, O'Herlihy C. Comparative analysis of international caesarean delivery rates using 10-group classification identifies significant variation in spontaneous labor. Am J Obstet Gynecol 2009;201(308):e301-e308.
7. Thomas Jparanjothy s and the Royal College of Obstetricians and Gynaecologists,clinical effectiveness support unit.The national sentinel caesarean section audit report.London; RCOG press, 2001.
8. Stavrou EP, Ford JB, Shand AW, Morris JM, Roberts CL. Epidemiology and trends for Caesarean section births in New South Wales, Australia: a population-based study. BMC Pregnancy Childbirth 2011;11:8.
9. Laws PJ, Sullivan EA. Australia's mothers and babies 2007. 2009. Sydney.
10. Kolås T, Hofoss D, Daltveit AK, Nilsen ST, Henriksen T, Häger R, et al. Indications for cesarean deliveries in Norway. Am J Obstet Gynecol 2003 Apr;188(4):864-870.
11. Lumbiganon P, Laopaiboon M, Gulmezoglu AM, Souza JP, Taneepanichskul S, Ruyan P, Attygalle DE, Shrestha N, Mori R, Nguyen DH, Method of delivery and pregnancy outcomes in Asia: the WHO global survey on maternal and perinatal health 2007-08. Lancet. pp. 490–499.
12. MacDorman MF, Menacker F, Declercq E. Cesarean birth in the United States: epidemiology, trends, and outcomes. Clin Perinatol 2008 Jun;35(2):293-307, v. v.
13. Yazdizadeh B, Nedjat S, Mohammad K, Rashidian A, Changizi N, Majdzadeh R. Cesarean section rate in Iran, multidimensional approaches for behavioral change of providers: a qualitative study. BMC Health Serv Res 2011;11:159.
14. Anderson GM, Lomas J. Determinants of the increasing caesarean birth rate.n eng j med, 1984;311;87-892.
15. The National Maternity Hospital Dublin. Ireland.Annual Clinical Report.Dublin; The National Maternity Hospital 2000;98-100.
16. Bernardes J, Costa-Pereira A, Ayres-de-Campos D, van Geijn HP, Pereira-Leite L. Evaluation of interobserver agreement of cardiotocograms. Int J Gynaecol Obstet 1997 Apr;57(1):33-37.
17. Amer-Wahlin I, Arulkumaran S, Hagberg H, Marsál K, Visser GH. Fetal electrocardiogram: ST waveform analysis in intrapartum surveillance. BJOG 2007 Oct;114(10):1191-1193.
18. Russillo B, Sewitch MJ, Cardinal L, Brassard N. Comparing rates of trial of labour attempts, VBAC success, and fetal and maternal complications among family physicians and obstetricians. J Obstet Gynaecol Can 2008 Feb;30(2):123-128.
|